- Resource Library
- Science
- Earth & Space Science
- Environmental Science
- Environmental Science 4.3 Population Growth

Environmental Science 4.3-Population Growth
Presentation
•
Science
•
12th Grade
•
Medium
+2
Standards-aligned

Abby Fancsali
Used 6+ times
FREE Resource
25 Slides • 17 Questions
1
Chapter 4.3-Population Growth

2
Multiple Choice
Which is the simplest level of organization within the environment?
cell
organism
population
community
3
Multiple Choice
4
Multiple Choice
5
Multiple Choice
Similar organisms that can reproduce with each other are considered to be members of the same _______________.
community
species
biosphere
ecosystem
6
Multiple Choice
All the alligators in the same area are an example of a(n) _______________.
organism
community
population
group
7
Multiple Choice
Study of populations in relation to environment, including environmental influences on density and distribution, age structure, and population size.
population ecology
community ecology
ecosystem ecology
biosphere ecology
8
Multiple Choice
Number of individuals per unit area or volume.
denisty
dispersion
survivorship
immigration
9

Lesson Objectives
Describe the factors that influence a population's growth rate
Explain Exponential growth and logistic growth
Explain how limiting factors and biotic potential affect population growth
10
Open Ended
Bacteria can reproduce once in about four minutes. A whale can reproduce once in a year. Why do you think there is such a large time difference between the two organisms?
11
Population Growth
A population increases in size when more individuals enter the population than leave it
Entering includes births and immigration
A population decreases in size when more individuals leave the population than enter it
Leaving includes death and emigration

12
Birth and Death Rates
Natality: the rate at which individuals are born
Mortality: The rate at which individuals die
Both Values are expressed as a number per 1000 individuals over a given time

13
Survivorship Curves
Individuals of different ages have different probabilities of dying
Survivorship Curve: a graph that shows how the likelihood of death varies with age
Three types of curve
Type I
Type II
Type III
14
Type I: Survivorship Curve
Type I: Most individuals survive young and die old
Example: Humans- More 80 year old people die than 10 year old

15
Type II: Survivorship Curve
Type II: An Individual's age does not affect the probability of their death
Example: Most bird species
16
Type III: Survivorship Curve
Type III: Most Individuals die young and adults are more likely to survive
Examples: Many plants and amphibians
17
Multiple Choice
A graphic way of representing the data in a life table.
survivorship curve
exponential growth curve
logistic growth curve
lag phase
18
Multiple Choice
19
Multiple Choice
Which Survivorship Curve describes populations whose mortality is highest at young ages
Type I
Type II
Type III
20
Immigration and Emmigration
Individuals in an animal population move around and can leave the population and join another one
Immigration: the arrival of individuals from outside the population
Emigration: The departure of individuals from a given area
21
Migration
Sometimes animals leave an area as part of a seasonal routine
Migration: The Seasonal Movement into and out of an area
This can lead to large population growth for limited periods of time that eventually return to normal

22
Calculating Population Growth
We can show the population growth with the following equation
A positive growth is an increase,
A Negative growth is a decrease
23
Calculating Population Growth Example Problem
A population's birthrate is 18 per 1000 and its death rate is 10 per 1000. In the same year, 5 individuals joined the population and 7 emigrated. What is the population growth?
24
Calculating Population Growth Example Problem
A population's birthrate is 18 per 1000 and its death rate is 10 per 1000. In the same year, 5 individuals joined the population and 7 emigrated. What is the population growth?
25
Fill in the Blank
A population's birthrate is 18 per 1000 and its death rate is 10 per 1000. In the same year, 5 individuals joined the population and 7 emigrated. What is the population growth rate per 1000 individuals?
26
Calculating Population Growth Example Problem
We can turn the Growth rate into a percentage that can be used to predict changes over time
Example: the growth 6/1000 individuals
27
How populations Grow
Growth rates are not a static measurement and can change depending on conditions at any given time
There are two main modes of population growth
Exponential Growth
Logistic Growth
28
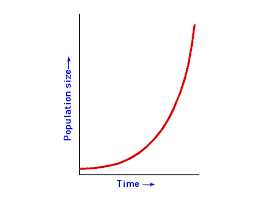
Exponential Growth
Exponential growth: When a population increases by a fixed percentage each year
Let's say we have a population of 1,000 individuals that has a growth rate of 10%
After the first year, they will increase by 10% (100) and have a total of 1100 in the population
After the 2nd year, they will increase by another 10% (110) and have a total of 1210
29
Exponential Growth
Exponential Growth occurs when the starting population is small and conditions are ideal
Makes a J-shaped graph

30
Limiting Factors
Exponential growth can only last a short time
Eventually, some resources run out
Limiting Factors: Characteristics of the environment that limit a population growth
Carrying Capacity: The Largest population size an environment can support
31
Logistic Growth
Logistic growth: A population grows exponentially until it comes close to the carrying capacity, and then slows/stops
If Carrying capacity is exceeded, the population will decrease back down to the carrying capacity

32
Population Growth in Nature
In reality, both curves are very simplified models of populations
Carrying capacities can fluctuate depending on the circumstances

33
Multiple Choice
The Largest number of individuals of a population that the environment can support is called the ___________
carrying capacity
population
biome
mutualism
34
Multiple Choice
What type of growth is shown in the diagram?
exponential growth
logistic growth
predator-prey cycle
boom-bust curve
35
Multiple Choice

When a population grows past the ecosystem's carrying capacity, what most likley happens to the population?
Continues to grow
The population starts to die off to return to carrying capcity
The population will go completely extinct due to lack of resources
36
Multiple Choice
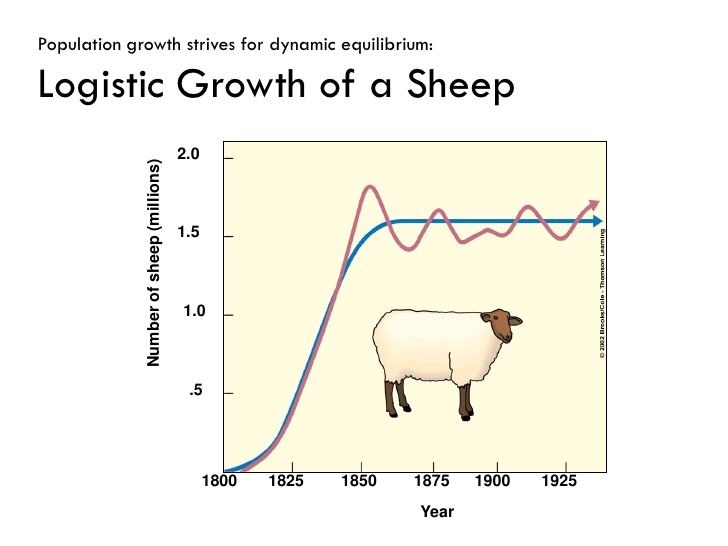
What is the carrying capacity for this sheep population?
2.0 million
1.0 million
1.6 million
0.5 million
37
Limiting Factors
Limiting Factors can slow population growth
can be sorted into two categories
Density Dependent
Density Independent
38
Density-Dependent Factors
Density-Dependent Factors: factors whose influence changes depending on how large the population is
The more individuals, the more competition for resources
Food, water, shelter
Larger populations have more chance for disease to spread and predators to attack
39
Density-Independent Factors
Density-Independent Factors: Factors whose influence is not affected by the size of the population
Includes factors like catastrophic events and severe weather
40
Biotic Potential
Individuals in a population affect how a population grows just as much as the environment they exist in.
Biotic Potential: The maximum ability of individuals to reproduce in ideal conditions

41
Factors that influence Biotic Potential
Gestation Time: How long it takes for offspring to develop before birth
Generation time: How long it takes for an individual to reach reproductive age
Number of Offspring Produced
42
Categorize
disease
Available Water
Available Food
Predators
Heavy Rain
Low Sunlight
Late Winter
An Earthquake
Organize the following factors into Density-Dependent and Density-Independent
Chapter 4.3-Population Growth
Show answer
Auto Play
Slide 1 / 42
SLIDE
Similar Resources on Wayground

41 questions
Photosynthesis
Lesson
•
11th Grade
40 questions
Medical Terminology
Lesson
•
12th Grade
38 questions
Skull Parts
Lesson
•
11th - 12th Grade
38 questions
Business Organizations
Lesson
•
12th Grade
38 questions
Lake turnover
Lesson
•
12th Grade
36 questions
Directional Terms, Cavities and Regional Names
Lesson
•
12th Grade
39 questions
Unit 2 Lesson 2: Vectors, Equilibrium,Support Force,&Friction
Lesson
•
12th Grade
33 questions
Origin of Life forms 2021
Lesson
•
11th - 12th Grade
Popular Resources on Wayground
15 questions
Fractions on a Number Line
Quiz
•
3rd Grade
14 questions
Boundaries & Healthy Relationships
Lesson
•
6th - 8th Grade
13 questions
SMS Cafeteria Expectations Quiz
Quiz
•
6th - 8th Grade
20 questions
Equivalent Fractions
Quiz
•
3rd Grade
25 questions
Multiplication Facts
Quiz
•
5th Grade
12 questions
SMS Restroom Expectations Quiz
Quiz
•
6th - 8th Grade
20 questions
Main Idea and Details
Quiz
•
5th Grade
10 questions
Pi Day Trivia!
Quiz
•
6th - 9th Grade
Discover more resources for Science
33 questions
Unit 5 Chemical Reactions Review
Quiz
•
9th - 12th Grade
24 questions
U8 Respiratory System Review
Quiz
•
12th Grade
9 questions
Explore Homeostasis and Feedback Mechanisms
Quiz
•
9th - 12th Grade
17 questions
Sex-Linked, Co and Incomplete Dominance
Quiz
•
9th - 12th Grade
6 questions
Adulting 101: Financial Reality Quiz
Quiz
•
9th - 12th Grade
19 questions
U7 Test: Matter and its Properties
Quiz
•
9th - 12th Grade
13 questions
Understand Mitosis Stages and Functions
Quiz
•
9th - 12th Grade
9 questions
The Mole Concept
Lesson
•
9th - 12th Grade