
Practice Reading Tables, Graphs, and Number Lines
Presentation
•
Social Studies, Science, Mathematics
•
3rd - 6th Grade
•
Medium

Kathryn Collier
Used 17+ times
FREE Resource
1 Slide • 10 Questions
1
2
Draw
3
Multiple Choice

4
Multiple Choice

Jonas makes a timeline to show important dates in his town's history. Which point on the timeline represents the year 1979?
5
Multiple Choice

What value is missing from the table?
6
Multiple Choice

Use the venn diagram. Which word belongs in the area where the sets overlap?
7
Multiple Choice

Gia took a survey of her classmates. She asked, "What is your favorite summer activity?" She received the following responses. How many classmates chose activities that must be done outdoors?
8
Multiple Choice

Which continent has 13% of wild cats?
9
Multiple Choice
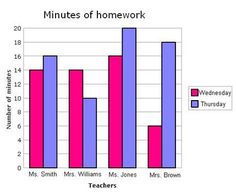
Which day had more minutes of homework?
10
Multiple Choice

How many more buckets of popcorn were sold on Saturday than on Sunday?
11
Multiple Choice
Show answer
Auto Play
Slide 1 / 11
SLIDE
Similar Resources on Wayground

11 questions
Study Jams: Sound
Lesson
•
3rd - 5th Grade
9 questions
2 digit x 2 digit multiplication
Lesson
•
3rd - 5th Grade
6 questions
Multi-Step Problem Solving Introduction
Lesson
•
3rd - 6th Grade
11 questions
Skeleton
Lesson
•
3rd - 6th Grade
9 questions
Geography Map Skills
Lesson
•
3rd - 5th Grade
9 questions
Acute Obtuse and Right angles
Lesson
•
3rd - 5th Grade
10 questions
CÀLCUL MENTAL : QUINZETS
Lesson
•
4th - 6th Grade
10 questions
states of matter
Lesson
•
4th - 5th Grade
Popular Resources on Wayground
8 questions
Spartan Way - Classroom Responsible
Quiz
•
9th - 12th Grade
15 questions
Fractions on a Number Line
Quiz
•
3rd Grade
14 questions
Boundaries & Healthy Relationships
Lesson
•
6th - 8th Grade
20 questions
Equivalent Fractions
Quiz
•
3rd Grade
3 questions
Integrity and Your Health
Lesson
•
6th - 8th Grade
25 questions
Multiplication Facts
Quiz
•
5th Grade
9 questions
FOREST Perception
Lesson
•
KG
20 questions
Main Idea and Details
Quiz
•
5th Grade
Discover more resources for Social Studies
17 questions
Texas Railroads, Oil & Gas
Quiz
•
4th Grade
17 questions
Ancient Rome
Quiz
•
3rd Grade
30 questions
Latin America in the Modern World: Modern Issues in Latin Amer
Quiz
•
6th Grade
37 questions
5G Social Studies 3rd 9wks Review
Quiz
•
5th Grade
29 questions
European Colonization and Religion in Latin America
Quiz
•
6th Grade
14 questions
*Reconstruction part 2
Quiz
•
4th Grade
12 questions
6th Grade Social Studies Interim 25-26 DOK 3 Review
Quiz
•
6th Grade
14 questions
New Nation Quiz - Fast and Curious
Quiz
•
4th Grade