Statistical Distributions and Characteristics
Interactive Video
•
Mathematics
•
10th - 12th Grade
•
Hard

Thomas White
FREE Resource
Read more
8 questions
Show all answers
1.
MULTIPLE CHOICE QUESTION
30 sec • 1 pt
What is the primary benefit of using visual displays like histograms over numerical metrics?
They require less data to be effective.
They are easier to create.
They eliminate the need for statistical analysis.
They provide a more engaging way to understand data.
2.
MULTIPLE CHOICE QUESTION
30 sec • 1 pt
Which type of distribution should you consider if your data is symmetric?
Normal distribution
Minimum extreme value distribution
Exponential distribution
Log-normal distribution
3.
MULTIPLE CHOICE QUESTION
30 sec • 1 pt
What percentage of data should fall within three standard deviations in a normal distribution?
99%
95%
100%
68%
4.
MULTIPLE CHOICE QUESTION
30 sec • 1 pt
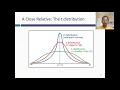
When is the T distribution more appropriate than the normal distribution?
When the data is discrete
When the sample size is small
When the sample size is large
When the data is skewed
5.
MULTIPLE CHOICE QUESTION
30 sec • 1 pt
What is a key characteristic of a triangular distribution?
It is unbounded.
It has a pronounced peak and is bounded.
It is always skewed to the right.
It has no peak.
6.
MULTIPLE CHOICE QUESTION
30 sec • 1 pt
Which distribution is suitable for data with a positive skew?
Uniform distribution
Log-normal distribution
Normal distribution
Triangular distribution
7.
MULTIPLE CHOICE QUESTION
30 sec • 1 pt
What does a kurtosis value greater than three indicate?
The distribution is mesokurtic.
The distribution has thin tails.
The distribution is symmetric.
The distribution has fat tails.
Access all questions and much more by creating a free account
Create resources
Host any resource
Get auto-graded reports
Continue with Google

Continue with Email
Continue with Classlink
Continue with Clever
or continue with
Microsoft
%20(1).png)
Apple
Others
Already have an account?
Popular Resources on Wayground

8 questions
Spartan Way - Classroom Responsible
Quiz
•
9th - 12th Grade
15 questions
Fractions on a Number Line
Quiz
•
3rd Grade
14 questions
Boundaries & Healthy Relationships
Lesson
•
6th - 8th Grade
20 questions
Equivalent Fractions
Quiz
•
3rd Grade
3 questions
Integrity and Your Health
Lesson
•
6th - 8th Grade
25 questions
Multiplication Facts
Quiz
•
5th Grade
9 questions
FOREST Perception
Lesson
•
KG
20 questions
Main Idea and Details
Quiz
•
5th Grade
Discover more resources for Mathematics
25 questions
Logos
Quiz
•
12th Grade
12 questions
Equation of a Circle
Lesson
•
10th Grade
14 questions
Making Inferences From Samples
Quiz
•
7th - 12th Grade
10 questions
Exploring Planet Earth and Its Unique Features
Interactive video
•
6th - 10th Grade
14 questions
Module 3 Topic 2 Vocabulary Quiz
Quiz
•
10th Grade
10 questions
Calculating the Volume of Rectangular Prisms
Interactive video
•
6th - 10th Grade
16 questions
Properties of Quadrilaterals
Quiz
•
11th Grade
23 questions
8th grade math unit 5B Perfect Squares and Cubes
Quiz
•
6th - 12th Grade