Data Visualization Techniques and Analysis
Interactive Video
•
Mathematics
•
9th - 10th Grade
•
Hard

Thomas White
FREE Resource
Read more
12 questions
Show all answers
1.
MULTIPLE CHOICE QUESTION
30 sec • 1 pt
What is the primary purpose of using scatter plots in data analysis?
To find the average of two variables
To investigate relationships between two numeric variables
To calculate the sum of two variables
To determine the median of a dataset
2.
MULTIPLE CHOICE QUESTION
30 sec • 1 pt
How can color and subsetting enhance data analysis?
By reducing the number of variables
By eliminating outliers
By answering more complex questions involving multiple variables
By simplifying the data
3.
MULTIPLE CHOICE QUESTION
30 sec • 1 pt
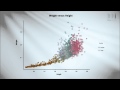
What data set is used to explore the relationship between weight and height?
WHO 2015
NHANES 2000
CDC 2020
USDA 2010
4.
MULTIPLE CHOICE QUESTION
30 sec • 1 pt
What is the purpose of using color gradients in data visualization?
To highlight errors in data
To simplify the graph
To make the graph more colorful
To visualize data trends and patterns
5.
MULTIPLE CHOICE QUESTION
30 sec • 1 pt
How is color used to investigate the effect of age in a scatter plot?
By changing the background color
By using different colors for different age bands
By removing age data
By using a single color for all ages
6.
MULTIPLE CHOICE QUESTION
30 sec • 1 pt
What does the color brown represent in the age-related scatter plot?
Elderly
Children under 10
Adults
Teenagers
7.
MULTIPLE CHOICE QUESTION
30 sec • 1 pt
How are genders differentiated in the scatter plot?
By using different sizes
By using different shapes
By using different colors
By using different patterns
Access all questions and much more by creating a free account
Create resources
Host any resource
Get auto-graded reports
Continue with Google

Continue with Email
Continue with Classlink
Continue with Clever
or continue with
Microsoft
%20(1).png)
Apple
Others
Already have an account?
Similar Resources on Wayground
Popular Resources on Wayground

15 questions
Fractions on a Number Line
Quiz
•
3rd Grade
20 questions
Equivalent Fractions
Quiz
•
3rd Grade
25 questions
Multiplication Facts
Quiz
•
5th Grade
22 questions
fractions
Quiz
•
3rd Grade
20 questions
Main Idea and Details
Quiz
•
5th Grade
20 questions
Context Clues
Quiz
•
6th Grade
15 questions
Equivalent Fractions
Quiz
•
4th Grade
20 questions
Figurative Language Review
Quiz
•
6th Grade
Discover more resources for Mathematics
20 questions
Graphing Inequalities on a Number Line
Quiz
•
6th - 9th Grade
12 questions
Exponential Growth and Decay
Quiz
•
9th Grade
20 questions
Exponent Rules Review
Quiz
•
8th - 9th Grade
25 questions
Complementary and Supplementary Angles
Quiz
•
7th - 10th Grade
12 questions
Add and Subtract Polynomials
Quiz
•
9th - 12th Grade
13 questions
Model Exponential Growth and Decay Scenarios
Quiz
•
9th - 12th Grade
15 questions
Combine Like Terms and Distributive Property
Quiz
•
8th - 9th Grade
27 questions
7.2.3 Quadrilateral Properties
Quiz
•
9th - 12th Grade