Statistical Concepts and Data Interpretation
Interactive Video
•
Mathematics
•
9th - 10th Grade
•
Hard

Thomas White
FREE Resource
Read more
13 questions
Show all answers
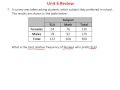
1.
MULTIPLE CHOICE QUESTION
30 sec • 1 pt
What is the main purpose of a histogram?
To display data in a tabular form
To show the frequency distribution of data
To compare two different data sets
To calculate the average of a data set
2.
MULTIPLE CHOICE QUESTION
30 sec • 1 pt
How many volunteers worked between 6 and 8 hours?
5
7
6
8
3.
MULTIPLE CHOICE QUESTION
30 sec • 1 pt
Which measure of central tendency is most affected by an outlier?
Range
Mode
Median
Mean
4.
MULTIPLE CHOICE QUESTION
30 sec • 1 pt
What is the median of the data set: 1, 2, 3, 3, 4, 5, 6?
2
3
4
5
5.
MULTIPLE CHOICE QUESTION
30 sec • 1 pt
In a box and whisker plot, what does the interquartile range represent?
The range of the middle 50% of the data
The difference between the maximum and minimum values
The average of the data set
The range of the entire data set
6.
MULTIPLE CHOICE QUESTION
30 sec • 1 pt
What percentage of eighth graders watched more than 8 hours of TV?
10%
25%
75%
50%
7.
MULTIPLE CHOICE QUESTION
30 sec • 1 pt
What type of correlation is indicated by a scatter plot where y decreases as x increases?
Perfect correlation
No correlation
Negative correlation
Positive correlation
Access all questions and much more by creating a free account
Create resources
Host any resource
Get auto-graded reports
Continue with Google

Continue with Email
Continue with Classlink
Continue with Clever
or continue with
Microsoft
%20(1).png)
Apple
Others
Already have an account?
Similar Resources on Wayground

11 questions
Linear Models and Data Analysis
Interactive video
•
9th - 12th Grade
11 questions
Sample Proportions and Expected Values
Interactive video
•
9th - 10th Grade
11 questions
Sampling Methods and Data Types
Interactive video
•
9th - 10th Grade
6 questions
Using Graphs to Persuade: Measures of Center and Variability
Interactive video
•
9th - 10th Grade
11 questions
Understanding Maps and Cartography Concepts
Interactive video
•
9th - 10th Grade
11 questions
Tucker Carlson's Rhetoric and Immigration
Interactive video
•
9th - 10th Grade
8 questions
CLEAN : Sade exhibit showcases writers fascination with human body
Interactive video
•
9th - 10th Grade
11 questions
Understanding Mean and Sampling in Statistics
Interactive video
•
9th - 12th Grade
Popular Resources on Wayground
7 questions
History of Valentine's Day
Interactive video
•
4th Grade
15 questions
Fractions on a Number Line
Quiz
•
3rd Grade
20 questions
Equivalent Fractions
Quiz
•
3rd Grade
25 questions
Multiplication Facts
Quiz
•
5th Grade
22 questions
fractions
Quiz
•
3rd Grade
15 questions
Valentine's Day Trivia
Quiz
•
3rd Grade
20 questions
Main Idea and Details
Quiz
•
5th Grade
20 questions
Context Clues
Quiz
•
6th Grade
Discover more resources for Mathematics
20 questions
Graphing Inequalities on a Number Line
Quiz
•
6th - 9th Grade
20 questions
Exponent Properties
Quiz
•
9th Grade
15 questions
Combine Like Terms and Distributive Property
Quiz
•
8th - 9th Grade
20 questions
Function or Not a Function
Quiz
•
8th - 9th Grade
10 questions
Factor Quadratic Expressions with Various Coefficients
Quiz
•
9th - 12th Grade
10 questions
Elijah McCoy: Innovations and Impact in Black History
Interactive video
•
6th - 10th Grade
21 questions
Factoring Trinomials (a=1)
Quiz
•
9th Grade
5 questions
Triangle Congruence Theorems
Interactive video
•
9th - 12th Grade