Understanding Graphs and Pulse Rates
Interactive Video
•
Mathematics
•
6th - 7th Grade
•
Hard

Thomas White
FREE Resource
Read more
11 questions
Show all answers
1.
MULTIPLE CHOICE QUESTION
30 sec • 1 pt
What is a linear graph?
A graph with zigzag lines
A graph with no lines
A graph with straight lines
A graph with curved lines
2.
MULTIPLE CHOICE QUESTION
30 sec • 1 pt
What does a nonlinear graph represent?
A dashed line
A curved or irregular line
A dotted line
A straight line
3.
MULTIPLE CHOICE QUESTION
30 sec • 1 pt
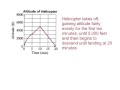
What two quantities are related in the helicopter example?
Altitude and time
Distance and speed
Speed and time
Height and distance
4.
MULTIPLE CHOICE QUESTION
30 sec • 1 pt
At what altitude does the helicopter reach its peak?
6,000 ft
3,000 ft
4,000 ft
5,000 ft
5.
MULTIPLE CHOICE QUESTION
30 sec • 1 pt
How long does it take for the helicopter to reach its peak altitude?
20 minutes
10 minutes
5 minutes
15 minutes
6.
MULTIPLE CHOICE QUESTION
30 sec • 1 pt
What is the purpose of creating graphs in the pulse rate example?
To measure speed
To measure altitude
To measure pulse rate over time
To measure distance
7.
MULTIPLE CHOICE QUESTION
30 sec • 1 pt
During which phase does the pulse rate increase?
Cool down
Sleep
Rest
Warm-up
Access all questions and much more by creating a free account
Create resources
Host any resource
Get auto-graded reports
Continue with Google

Continue with Email
Continue with Classlink
Continue with Clever
or continue with
Microsoft
%20(1).png)
Apple
Others
Already have an account?
