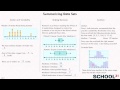
Data Representation and Analysis Concepts
Interactive Video
•
Mathematics
•
9th - 10th Grade
•
Practice Problem
•
Hard

Thomas White
FREE Resource
Read more
9 questions
Show all answers
1.
MULTIPLE CHOICE QUESTION
30 sec • 1 pt
What are the three types of plots introduced for data representation?
Pie charts, bar charts, dot plots
Histograms, dot plots, box plots
Bar charts, line graphs, pie charts
Scatter plots, line graphs, histograms
2.
MULTIPLE CHOICE QUESTION
30 sec • 1 pt
What two aspects of data are important to understand from dot plots?
Center and variability
Mean and mode
Range and outliers
Median and frequency
3.
MULTIPLE CHOICE QUESTION
30 sec • 1 pt
In the dot plot of students' reading habits, what was the most common number of books read?
Twelve
Four
Six
Five
4.
MULTIPLE CHOICE QUESTION
30 sec • 1 pt
Why is visual representation of data important?
It helps in identifying patterns and summarizing data
It is required for all scientific studies
It is easier to create than numerical data
It makes data look more appealing
5.
MULTIPLE CHOICE QUESTION
30 sec • 1 pt
What was the median enzyme count for both medications in the study?
27
25
23
21
6.
MULTIPLE CHOICE QUESTION
30 sec • 1 pt
How is the interquartile range calculated in a box plot?
By subtracting the mean from the median
By dividing the range by two
By finding the difference between the upper and lower quartiles
By adding the upper and lower quartiles
7.
MULTIPLE CHOICE QUESTION
30 sec • 1 pt
Which medication showed more consistency in enzyme count?
Neither showed consistency
Medicine A
Both were equally consistent
Medicine B
Access all questions and much more by creating a free account
Create resources
Host any resource
Get auto-graded reports
Continue with Google

Continue with Email
Continue with Classlink
Continue with Clever
or continue with
Microsoft
%20(1).png)
Apple
Others
Already have an account?
Similar Resources on Wayground

6 questions
Understanding Elon Musk's Access to Federal Payment Systems
Interactive video
•
9th - 10th Grade
6 questions
Understanding Earthquakes and Elastic Rebound Theory
Interactive video
•
9th - 10th Grade
6 questions
Understanding Observations in Science
Interactive video
•
9th - 10th Grade
11 questions
Weather Station Models Quiz
Interactive video
•
9th - 10th Grade
11 questions
Google for Education Security Update Quiz
Interactive video
•
9th - 10th Grade
11 questions
Google Docs GMTH Add-on Quiz
Interactive video
•
9th - 10th Grade
6 questions
Dynamic Pricing in Fast Food
Interactive video
•
9th - 10th Grade
6 questions
Understanding Online Banking
Interactive video
•
9th - 10th Grade
Popular Resources on Wayground
7 questions
History of Valentine's Day
Interactive video
•
4th Grade
15 questions
Fractions on a Number Line
Quiz
•
3rd Grade
20 questions
Equivalent Fractions
Quiz
•
3rd Grade
25 questions
Multiplication Facts
Quiz
•
5th Grade
22 questions
fractions
Quiz
•
3rd Grade
15 questions
Valentine's Day Trivia
Quiz
•
3rd Grade
20 questions
Main Idea and Details
Quiz
•
5th Grade
20 questions
Context Clues
Quiz
•
6th Grade
Discover more resources for Mathematics
20 questions
Graphing Inequalities on a Number Line
Quiz
•
6th - 9th Grade
20 questions
Exponent Properties
Quiz
•
9th Grade
15 questions
Combine Like Terms and Distributive Property
Quiz
•
8th - 9th Grade
20 questions
Function or Not a Function
Quiz
•
8th - 9th Grade
10 questions
Factor Quadratic Expressions with Various Coefficients
Quiz
•
9th - 12th Grade
10 questions
Elijah McCoy: Innovations and Impact in Black History
Interactive video
•
6th - 10th Grade
21 questions
Factoring Trinomials (a=1)
Quiz
•
9th Grade
5 questions
Triangle Congruence Theorems
Interactive video
•
9th - 12th Grade