Energy Graphs and Their Interpretations
Interactive Video
•
Physics
•
4th - 12th Grade
•
Practice Problem
•
Hard

Thomas White
FREE Resource
Read more
8 questions
Show all answers
1.
MULTIPLE CHOICE QUESTION
30 sec • 1 pt
What is the primary focus of the skating track in the video?
To demonstrate energy transformation
To show the speed of the skater
To calculate the distance traveled
To measure the skater's weight
2.
MULTIPLE CHOICE QUESTION
30 sec • 1 pt
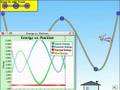
What does the pie graph above the skater represent?
The skater's weight
The total energy
The distance traveled
The skater's speed
3.
MULTIPLE CHOICE QUESTION
30 sec • 1 pt
In the bar graph, which energy remains constant?
Total energy
Potential energy
Kinetic energy
Thermal energy
4.
MULTIPLE CHOICE QUESTION
30 sec • 1 pt
How does the potential energy graph relate to the skater's track?
It is unrelated to the track
It matches the shape of the track
It is the inverse of the track
It is a straight line
5.
MULTIPLE CHOICE QUESTION
30 sec • 1 pt
What is the nature of the energy versus time graph?
It decreases over time
It remains constant
It displays a cyclical pattern
It shows a linear increase
6.
MULTIPLE CHOICE QUESTION
30 sec • 1 pt
What does the thermal graph indicate when friction is turned on?
The distance traveled
The effect of friction
The skater's weight
The skater's speed
7.
MULTIPLE CHOICE QUESTION
30 sec • 1 pt
What can be done with the graphs for educational purposes?
They can be recorded and replayed
They can be ignored
They can be hidden
They can be deleted
Access all questions and much more by creating a free account
Create resources
Host any resource
Get auto-graded reports
Continue with Google

Continue with Email
Continue with Classlink
Continue with Clever
or continue with
Microsoft
%20(1).png)
Apple
Others
Already have an account?
