Analyzing Paper Bridge Experiments
Interactive Video
•
Mathematics
•
9th - 10th Grade
•
Practice Problem
•
Hard

Thomas White
FREE Resource
Read more
10 questions
Show all answers
1.
MULTIPLE CHOICE QUESTION
30 sec • 1 pt
What was the purpose of the experiment conducted by the students?
To measure the length of bridges
To test the load-bearing capacity of paper bridges
To test the color of paper bridges
To count the number of pennies in a stack
2.
MULTIPLE CHOICE QUESTION
30 sec • 1 pt
What is the independent variable in the experiment?
Time taken to collapse
Bridge material
Bridge length
Number of pennies
3.
MULTIPLE CHOICE QUESTION
30 sec • 1 pt
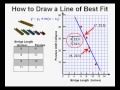
How many squares were available on the horizontal axis for plotting?
15 squares
10 squares
20 squares
25 squares
4.
MULTIPLE CHOICE QUESTION
30 sec • 1 pt
What scale was used for the vertical axis to plot the number of pennies?
Four squares for every 10 pennies
One square for every penny
Five squares for every 20 pennies
Two squares for every 5 pennies
5.
MULTIPLE CHOICE QUESTION
30 sec • 1 pt
What kind of correlation was observed between bridge length and load capacity?
Positive correlation
Negative correlation
No correlation
Exponential correlation
6.
MULTIPLE CHOICE QUESTION
30 sec • 1 pt
What mistake did some students make when drawing the line of best fit?
They used a curved line
They connected the dots with line segments
They used a ruler
They drew a single straight line
7.
MULTIPLE CHOICE QUESTION
30 sec • 1 pt
What is the formula used to calculate the slope of the line of best fit?
y = mx + b
y - y1 = m(x - x1)
x = my + b
y = x + b
Access all questions and much more by creating a free account
Create resources
Host any resource
Get auto-graded reports
Continue with Google

Continue with Email
Continue with Classlink
Continue with Clever
or continue with
Microsoft
%20(1).png)
Apple
Others
Already have an account?
Popular Resources on Wayground

7 questions
History of Valentine's Day
Interactive video
•
4th Grade
15 questions
Fractions on a Number Line
Quiz
•
3rd Grade
20 questions
Equivalent Fractions
Quiz
•
3rd Grade
25 questions
Multiplication Facts
Quiz
•
5th Grade
22 questions
fractions
Quiz
•
3rd Grade
15 questions
Valentine's Day Trivia
Quiz
•
3rd Grade
20 questions
Main Idea and Details
Quiz
•
5th Grade
20 questions
Context Clues
Quiz
•
6th Grade
Discover more resources for Mathematics
20 questions
Graphing Inequalities on a Number Line
Quiz
•
6th - 9th Grade
20 questions
Exponent Properties
Quiz
•
9th Grade
15 questions
Combine Like Terms and Distributive Property
Quiz
•
8th - 9th Grade
20 questions
Function or Not a Function
Quiz
•
8th - 9th Grade
10 questions
Factor Quadratic Expressions with Various Coefficients
Quiz
•
9th - 12th Grade
10 questions
Elijah McCoy: Innovations and Impact in Black History
Interactive video
•
6th - 10th Grade
21 questions
Factoring Trinomials (a=1)
Quiz
•
9th Grade
5 questions
Triangle Congruence Theorems
Interactive video
•
9th - 12th Grade