Regression Models and Data Interpretation
Interactive Video
•
Mathematics
•
9th - 10th Grade
•
Practice Problem
•
Hard

Thomas White
FREE Resource
Read more
12 questions
Show all answers
1.
MULTIPLE CHOICE QUESTION
30 sec • 1 pt
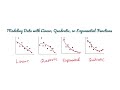
What types of data are being identified in this lesson?
Linear, Logarithmic, Polynomial
Linear, Cubic, Logarithmic
Quadratic, Cubic, Exponential
Linear, Quadratic, Exponential
2.
MULTIPLE CHOICE QUESTION
30 sec • 1 pt
Why is a graphing calculator necessary for this lesson?
To draw graphs manually
To perform complex calculations
To find regression models
To solve algebraic equations
3.
MULTIPLE CHOICE QUESTION
30 sec • 1 pt
In the warm-up exercise, what formula is used to compare Lisa and Laura's accounts?
Linear Growth Formula
Compound Interest Formula
Simple Interest Formula
Exponential Decay Formula
4.
MULTIPLE CHOICE QUESTION
30 sec • 1 pt
What is the key feature of linear data in a table of values?
Common ratio in x-values
Common difference in x-values
Common ratio in y-values
Common difference in y-values
5.
MULTIPLE CHOICE QUESTION
30 sec • 1 pt
How can you identify quadratic data from a table of values?
Common ratio of differences in y-values
Common difference of differences in y-values
Common ratio in y-values
Common difference in y-values
6.
MULTIPLE CHOICE QUESTION
30 sec • 1 pt
What indicates exponential data in a table of values?
Common difference in x-values
Common ratio in x-values
Common ratio in y-values
Common difference in y-values
7.
MULTIPLE CHOICE QUESTION
30 sec • 1 pt
When interpreting scatter plots, what is a key consideration?
Exact quadratic fit
Perfect linearity
General trend estimation
Exact match of data points
Access all questions and much more by creating a free account
Create resources
Host any resource
Get auto-graded reports
Continue with Google

Continue with Email
Continue with Classlink
Continue with Clever
or continue with
Microsoft
%20(1).png)
Apple
Others
Already have an account?
Similar Resources on Wayground

11 questions
Tucker Carlson's Rhetoric and Immigration
Interactive video
•
9th - 10th Grade
11 questions
Sample Proportions and Expected Values
Interactive video
•
9th - 10th Grade
11 questions
Sampling Methods and Data Types
Interactive video
•
9th - 10th Grade
11 questions
Direct and Inverse Variation Concepts
Interactive video
•
9th - 10th Grade
11 questions
Understanding Functions and Their Properties
Interactive video
•
9th - 10th Grade
6 questions
Using Graphs to Persuade: Measures of Center and Variability
Interactive video
•
9th - 10th Grade
8 questions
CLEAN : Sade exhibit showcases writers fascination with human body
Interactive video
•
9th - 10th Grade
11 questions
Understanding Maps and Cartography Concepts
Interactive video
•
9th - 10th Grade
Popular Resources on Wayground
7 questions
History of Valentine's Day
Interactive video
•
4th Grade
15 questions
Fractions on a Number Line
Quiz
•
3rd Grade
20 questions
Equivalent Fractions
Quiz
•
3rd Grade
25 questions
Multiplication Facts
Quiz
•
5th Grade
22 questions
fractions
Quiz
•
3rd Grade
15 questions
Valentine's Day Trivia
Quiz
•
3rd Grade
20 questions
Main Idea and Details
Quiz
•
5th Grade
20 questions
Context Clues
Quiz
•
6th Grade
Discover more resources for Mathematics
20 questions
Graphing Inequalities on a Number Line
Quiz
•
6th - 9th Grade
20 questions
Exponent Properties
Quiz
•
9th Grade
15 questions
Combine Like Terms and Distributive Property
Quiz
•
8th - 9th Grade
20 questions
Function or Not a Function
Quiz
•
8th - 9th Grade
10 questions
Factor Quadratic Expressions with Various Coefficients
Quiz
•
9th - 12th Grade
10 questions
Elijah McCoy: Innovations and Impact in Black History
Interactive video
•
6th - 10th Grade
21 questions
Factoring Trinomials (a=1)
Quiz
•
9th Grade
5 questions
Triangle Congruence Theorems
Interactive video
•
9th - 12th Grade