Understanding Stem-and-Leaf Plots
Interactive Video
•
Mathematics
•
9th - 10th Grade
•
Practice Problem
•
Hard

Thomas White
FREE Resource
Read more
9 questions
Show all answers
1.
MULTIPLE CHOICE QUESTION
30 sec • 1 pt
What is the main focus of the video series introduced by Parmalee Kumar?
Displaying data using stem-and-leaf plots
Creating bar graphs
Understanding pie charts
Learning about histograms
2.
MULTIPLE CHOICE QUESTION
30 sec • 1 pt
What are the two tasks mentioned in the problem statement?
Drawing a pie chart and calculating the mean
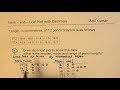
Creating a stem-and-leaf plot and finding the median, mode, and range
Constructing a bar graph and finding the standard deviation
Making a line graph and calculating the variance
3.
MULTIPLE CHOICE QUESTION
30 sec • 1 pt
What is the first step in creating a stem-and-leaf plot?
Finding the range
Drawing a bar graph
Isolating the last digit for the leaf part
Calculating the mean
4.
MULTIPLE CHOICE QUESTION
30 sec • 1 pt
How should the data be arranged in a stem-and-leaf plot?
In alphabetical order
In numerical order
In random order
In descending order
5.
MULTIPLE CHOICE QUESTION
30 sec • 1 pt
Why is it important to include a key in a stem-and-leaf plot?
To accurately represent the data
To make the plot look more colorful
To make it easier to draw
To add more data points
6.
MULTIPLE CHOICE QUESTION
30 sec • 1 pt
How is the median of a data set determined?
By locating the middle value in an ordered data set
By identifying the most frequently occurring number
By subtracting the smallest number from the largest
By finding the average of all numbers
7.
MULTIPLE CHOICE QUESTION
30 sec • 1 pt
What indicates the mode in a data set?
The lowest number
The number that appears most frequently
The highest number
The average of all numbers
Access all questions and much more by creating a free account
Create resources
Host any resource
Get auto-graded reports
Continue with Google

Continue with Email
Continue with Classlink
Continue with Clever
or continue with
Microsoft
%20(1).png)
Apple
Others
Already have an account?
