- Resource Library
- Math
- Probability And Statistics
- Shapes Of Distributions
- Understanding Data Distributions And Measures
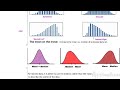
Understanding Data Distributions and Measures
Interactive Video
•
Mathematics
•
9th - 10th Grade
•
Practice Problem
•
Hard

Thomas White
FREE Resource
Read more
10 questions
Show all answers
1.
MULTIPLE CHOICE QUESTION
30 sec • 1 pt
What is a data distribution?
A type of data entry
A list of numbers
A mathematical formula
A graph showing data frequency
2.
MULTIPLE CHOICE QUESTION
30 sec • 1 pt
When is a dot plot most useful?
For datasets with no values
For datasets with only one value
For datasets with 20 or fewer values
For datasets with more than 100 values
3.
MULTIPLE CHOICE QUESTION
30 sec • 1 pt
How do you calculate the mean from a dot plot?
Add all values and divide by the number of values
Find the middle value
Subtract the smallest value from the largest
Multiply all values together
4.
MULTIPLE CHOICE QUESTION
30 sec • 1 pt
What is a normal distribution often called?
A random distribution
A skewed distribution
A bell curve
A flat line
5.
MULTIPLE CHOICE QUESTION
30 sec • 1 pt
What does bimodal mean in terms of data distribution?
Data with no mode
Data with two modes
Data with one mode
Data with three modes
6.
MULTIPLE CHOICE QUESTION
30 sec • 1 pt
What is an example of skewed left data?
Household income
GPA scores
Number of pets
Height of students
7.
MULTIPLE CHOICE QUESTION
30 sec • 1 pt
In skewed right data, how does the mean compare to the median?
The mean is less than the median
The mean is not related to the median
The mean is equal to the median
The mean is greater than the median
Access all questions and much more by creating a free account
Create resources
Host any resource
Get auto-graded reports
Continue with Google

Continue with Email
Continue with Classlink
Continue with Clever
or continue with
Microsoft
%20(1).png)
Apple
Others
Already have an account?
