- Resource Library
- Math
- Probability And Statistics
- Shapes Of Distributions
- Understanding Data Distributions And Measures
Understanding Data Distributions and Measures
Interactive Video
•
Mathematics
•
9th - 10th Grade
•
Practice Problem
•
Hard

Thomas White
FREE Resource
Read more
10 questions
Show all answers
1.
MULTIPLE CHOICE QUESTION
30 sec • 1 pt
What is the primary purpose of understanding data distributions?
To simplify data collection
To predict future events
To understand the frequency of data values
To create complex mathematical models
2.
MULTIPLE CHOICE QUESTION
30 sec • 1 pt
Which type of plot is best for datasets with 20 or fewer values?
Bar chart
Line graph
Dot plot
Histogram
3.
MULTIPLE CHOICE QUESTION
30 sec • 1 pt
How do you calculate the mean from a set of data points?
Add all numbers and divide by the number of data points
Find the middle value
Subtract the smallest value from the largest
Multiply all numbers together
4.
MULTIPLE CHOICE QUESTION
30 sec • 1 pt
What is a symmetric distribution?
A distribution skewed to the right
A distribution with no variation
A distribution with equal values on both sides of the median
A distribution with two peaks
5.
MULTIPLE CHOICE QUESTION
30 sec • 1 pt
What does 'bimodal' mean in terms of data distribution?
Data with two modes
Data with equal distribution
Data with no mode
Data with a single peak
6.
MULTIPLE CHOICE QUESTION
30 sec • 1 pt
What is an example of skewed left data?
Household income
GPA scores
Foot size of adults
Age of death
7.
MULTIPLE CHOICE QUESTION
30 sec • 1 pt
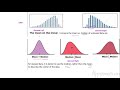
In skewed right data, how does the mean compare to the median?
Mean is less than the median
Mean is equal to the median
Mean is greater than the median
Mean is not affected by skewness
Access all questions and much more by creating a free account
Create resources
Host any resource
Get auto-graded reports
Continue with Google

Continue with Email
Continue with Classlink
Continue with Clever
or continue with
Microsoft
%20(1).png)
Apple
Others
Already have an account?
Popular Resources on Wayground

15 questions
Fractions on a Number Line
Quiz
•
3rd Grade
20 questions
Equivalent Fractions
Quiz
•
3rd Grade
25 questions
Multiplication Facts
Quiz
•
5th Grade
29 questions
Alg. 1 Section 5.1 Coordinate Plane
Quiz
•
9th Grade
22 questions
fractions
Quiz
•
3rd Grade
11 questions
FOREST Effective communication
Lesson
•
KG
20 questions
Main Idea and Details
Quiz
•
5th Grade
20 questions
Context Clues
Quiz
•
6th Grade
Discover more resources for Mathematics
29 questions
Alg. 1 Section 5.1 Coordinate Plane
Quiz
•
9th Grade
20 questions
Graphing Inequalities on a Number Line
Quiz
•
6th - 9th Grade
20 questions
Box and Whisker Plots
Quiz
•
9th Grade
18 questions
Exponential Growth and Decay
Quiz
•
9th Grade
20 questions
Function or Not a Function
Quiz
•
8th - 9th Grade
20 questions
SSS/SAS
Quiz
•
9th - 12th Grade
14 questions
Making Inferences From Samples
Quiz
•
7th - 12th Grade
23 questions
CCG - CH8 Polygon angles and area Review
Quiz
•
9th - 12th Grade