What is the primary purpose of adding trend lines to scatter plots?

Understanding Scatter Plots and Relationships

Interactive Video
•
Computers
•
9th - 10th Grade
•
Hard

Thomas White
FREE Resource
Read more
8 questions
Show all answers
1.
MULTIPLE CHOICE QUESTION
30 sec • 1 pt
To change the axis labels
To add more data points
To visualize the relationship between variables
To make the plot look more colorful
2.
MULTIPLE CHOICE QUESTION
30 sec • 1 pt
Which two axes are used in a scatter plot?
X-axis and Z-axis
X-axis and Y-axis
Y-axis and Z-axis
None of the above
3.
MULTIPLE CHOICE QUESTION
30 sec • 1 pt
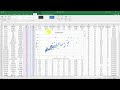
In the example with minimum price and horsepower, which variable is placed on the x-axis?
Horsepower
Miles per gallon
Minimum price
Average price
4.
MULTIPLE CHOICE QUESTION
30 sec • 1 pt
What is the first step in adding axis titles to a scatter plot in Excel?
Insert a new chart
Change the chart type
Go to the design tab and add chart element
Right-click on the chart
5.
MULTIPLE CHOICE QUESTION
30 sec • 1 pt
What type of relationship is observed between price and horsepower?
Positive relationship
Curved relationship
Negative relationship
No relationship
6.
MULTIPLE CHOICE QUESTION
30 sec • 1 pt
What happens to miles per gallon as horsepower increases?
It fluctuates randomly
It remains constant
It decreases
It increases
7.
MULTIPLE CHOICE QUESTION
30 sec • 1 pt
What is the relationship between price and U-turn radius?
Unclear relationship
Clear positive relationship
No relationship
Clear negative relationship
8.
MULTIPLE CHOICE QUESTION
30 sec • 1 pt
What is the main takeaway from the video regarding scatter plots?
Scatter plots are only used for financial data
Scatter plots are not useful for data analysis
Scatter plots can show different types of relationships
Scatter plots are only useful for positive relationships
Similar Resources on Quizizz
6 questions
Data Science Prerequisites - Numpy, Matplotlib, and Pandas in Python - Matplotlib Section Introduction

Interactive video
•
9th - 10th Grade
6 questions
Deep Learning - Computer Vision for Beginners Using PyTorch - Plot Formatting and Scatter Plot

Interactive video
•
9th - 10th Grade
4 questions
pandas for Python - A Quick Guide - Visualize your Data

Interactive video
•
9th - 10th Grade
2 questions
Practical Data Science using Python - Linear Regression Data Preparation and Analysis 2

Interactive video
•
9th - 10th Grade
8 questions
Data Visualization and Analysis Concepts

Interactive video
•
9th - 10th Grade
8 questions
R Programming for Statistics and Data Science - Building a Scatterplot with ggplot2

Interactive video
•
9th - 10th Grade
6 questions
Study Time and Test Scores Analysis

Interactive video
•
9th - 10th Grade
6 questions
Deep Learning - Computer Vision for Beginners Using PyTorch - Plot Formatting and Scatter Plot

Interactive video
•
9th - 10th Grade
Popular Resources on Quizizz
15 questions
Multiplication Facts

Quiz
•
4th Grade
20 questions
Math Review - Grade 6

Quiz
•
6th Grade
20 questions
math review

Quiz
•
4th Grade
5 questions
capitalization in sentences

Quiz
•
5th - 8th Grade
10 questions
Juneteenth History and Significance

Interactive video
•
5th - 8th Grade
15 questions
Adding and Subtracting Fractions

Quiz
•
5th Grade
10 questions
R2H Day One Internship Expectation Review Guidelines

Quiz
•
Professional Development
12 questions
Dividing Fractions

Quiz
•
6th Grade
Discover more resources for Computers
25 questions
Spanish preterite verbs (irregular/changed)

Quiz
•
9th - 10th Grade
10 questions
Identify Slope and y-intercept (from equation)

Quiz
•
8th - 9th Grade
10 questions
Juneteenth: History and Significance

Interactive video
•
7th - 12th Grade
8 questions
"Keeping the City of Venice Afloat" - STAAR Bootcamp, Day 1

Quiz
•
9th - 12th Grade
26 questions
June 19th

Quiz
•
4th - 9th Grade
20 questions
Distance, Midpoint, and Slope

Quiz
•
10th Grade
20 questions
Figurative Language Review

Quiz
•
10th Grade
27 questions
STAAR English 1 Review

Quiz
•
9th Grade