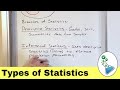
Inferential and Descriptive Statistics Concepts
Interactive Video
•
Mathematics
•
9th - 10th Grade
•
Practice Problem
•
Hard

Thomas White
FREE Resource
Read more
10 questions
Show all answers
1.
MULTIPLE CHOICE QUESTION
30 sec • 1 pt
What is a sample in the context of statistics?
A complete collection of data points.
A type of statistical error.
A visual representation of data.
A subset of the population being studied.
2.
MULTIPLE CHOICE QUESTION
30 sec • 1 pt
Why is it important to visualize the concept of population and sample?
To simplify statistical formulas.
To avoid confusion between population and sample.
To make calculations easier.
To ensure data accuracy.
3.
MULTIPLE CHOICE QUESTION
30 sec • 1 pt
Which of the following is NOT a branch of statistics?
Inferential statistics
Analytical statistics
Descriptive statistics
Predictive statistics
4.
MULTIPLE CHOICE QUESTION
30 sec • 1 pt
What is the primary purpose of descriptive statistics?
To predict future trends.
To describe and summarize data.
To estimate population parameters.
To draw conclusions from data.
5.
MULTIPLE CHOICE QUESTION
30 sec • 1 pt
Which of the following is an example of descriptive statistics?
Predicting election outcomes.
Creating a pie chart of favorite ice cream flavors.
Estimating the average height of all adults in a city.
Calculating the probability of rain tomorrow.
6.
MULTIPLE CHOICE QUESTION
30 sec • 1 pt
What does inferential statistics primarily involve?
Drawing conclusions from sample data.
Describing data sets.
Calculating exact population parameters.
Creating visual data representations.
7.
MULTIPLE CHOICE QUESTION
30 sec • 1 pt
Why is it challenging to know population parameters with certainty?
Because data collection is always inaccurate.
Because populations are too large to survey entirely.
Because statistical methods are flawed.
Because parameters change frequently.
Access all questions and much more by creating a free account
Create resources
Host any resource
Get auto-graded reports
Continue with Google

Continue with Email
Continue with Classlink
Continue with Clever
or continue with
Microsoft
%20(1).png)
Apple
Others
Already have an account?
