Understanding Ratio Tables and Graphs
Interactive Video
•
Mathematics
•
6th - 7th Grade
•
Practice Problem
•
Easy

Thomas White
Used 3+ times
FREE Resource
Read more
8 questions
Show all answers
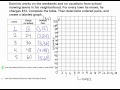
1.
MULTIPLE CHOICE QUESTION
30 sec • 1 pt
What is the main focus of this lesson?
Studying geometric shapes
Representing information in a ratio table and graphing it
Learning about algebraic equations
Understanding fractions
2.
MULTIPLE CHOICE QUESTION
30 sec • 1 pt
What does Dominic charge for mowing one lawn?
$15
$10
$12
$20
3.
MULTIPLE CHOICE QUESTION
30 sec • 1 pt
How can you organize information to create an ordered pair?
By using a pie chart
By using a ratio table
By using a bar graph
By using a histogram
4.
MULTIPLE CHOICE QUESTION
30 sec • 1 pt
What is the relationship between the x and y axes in this context?
X-axis represents time, Y-axis represents speed
X-axis represents lawns, Y-axis represents charge
X-axis represents charge, Y-axis represents lawns
X-axis represents distance, Y-axis represents time
5.
MULTIPLE CHOICE QUESTION
30 sec • 1 pt
What is the first ordered pair in the ratio table?
(1, 12)
(2, 24)
(3, 36)
(4, 48)
6.
MULTIPLE CHOICE QUESTION
30 sec • 1 pt
What should a graph in a ratio table always form?
A dotted line
A zigzag line
A curved line
A straight line
7.
MULTIPLE CHOICE QUESTION
30 sec • 1 pt
How many lawns does Dominic need to mow to earn $240?
15
20
25
30
Access all questions and much more by creating a free account
Create resources
Host any resource
Get auto-graded reports
Continue with Google

Continue with Email
Continue with Classlink
Continue with Clever
or continue with
Microsoft
%20(1).png)
Apple
Others
Already have an account?
