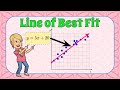
Line of Best Fit Concepts
Interactive Video
•
Mathematics
•
6th - 7th Grade
•
Practice Problem
•
Medium

Thomas White
Used 5+ times
FREE Resource
Read more
12 questions
Show all answers
1.
MULTIPLE CHOICE QUESTION
30 sec • 1 pt
What is the primary purpose of a line of best fit in a scatter plot?
To connect all data points
To highlight the highest data point
To separate data into two groups
To show the trend of the data
2.
MULTIPLE CHOICE QUESTION
30 sec • 1 pt
Which of the following is a learning objective related to the line of best fit?
Memorize all data points
Identify and use a line of best fit
Draw a perfect circle around data
Calculate the average of data points
3.
MULTIPLE CHOICE QUESTION
30 sec • 1 pt
What does a positive linear relationship indicate on a scatter plot?
Data points form a perfect circle
Data points decrease as you move right
Data points are scattered randomly
Data points increase as you move right
4.
MULTIPLE CHOICE QUESTION
30 sec • 1 pt
What is a key characteristic of a line of best fit?
It should be a curved line
It must pass through all data points
It should be horizontal
It should balance points above and below
5.
MULTIPLE CHOICE QUESTION
30 sec • 1 pt
When drawing a line of best fit, what is the goal regarding data points?
Balance points above and below the line
Ignore the data points
Have more points below the line
Have more points above the line
6.
MULTIPLE CHOICE QUESTION
30 sec • 1 pt
In the example graphs, which choice was identified as the best line of fit?
Choice B
Choice D
Choice C
Choice A
7.
MULTIPLE CHOICE QUESTION
30 sec • 1 pt
What does the equation y = 8.3x + 18 represent in the context of the line of best fit?
A random equation
The equation of the line of best fit
The equation of a circle
The equation of a parabola
Access all questions and much more by creating a free account
Create resources
Host any resource
Get auto-graded reports
Continue with Google

Continue with Email
Continue with Classlink
Continue with Clever
or continue with
Microsoft
%20(1).png)
Apple
Others
Already have an account?
