- Resource Library
- Math
- Probability And Statistics
- Data Visualization
- Data Display And Visualization Concepts
Data Display and Visualization Concepts
Interactive Video
•
Mathematics
•
6th - 7th Grade
•
Practice Problem
•
Hard

Ethan Morris
FREE Resource
Read more
8 questions
Show all answers
1.
MULTIPLE CHOICE QUESTION
30 sec • 1 pt
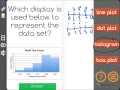
Which type of data display uses a number line and marks each data point with an 'X'?
Dot Plot
Line Plot
Box Plot
Histogram
2.
MULTIPLE CHOICE QUESTION
30 sec • 1 pt
In a dot plot, what is used to represent each data point?
Bars
Boxes
Dots
Lines
3.
MULTIPLE CHOICE QUESTION
30 sec • 1 pt
What is the main difference between a line plot and a dot plot?
Line plots are vertical, dot plots are horizontal.
Line plots are for categorical data, dot plots for numerical data.
Line plots use 'X's, dot plots use dots.
Line plots use lines, dot plots use bars.
4.
MULTIPLE CHOICE QUESTION
30 sec • 1 pt
What is a key characteristic of a histogram?
It is similar to a line plot.
It has connected bars to show data distribution.
It uses dots to represent data points.
It has bars that are not connected.
5.
MULTIPLE CHOICE QUESTION
30 sec • 1 pt
Which plot is most similar to a bar graph but with connected bars?
Line Plot
Box Plot
Dot Plot
Histogram
6.
MULTIPLE CHOICE QUESTION
30 sec • 1 pt
Which plot would you use to see the distribution of data across different categories?
Histogram
Box Plot
Dot Plot
Line Plot
7.
MULTIPLE CHOICE QUESTION
30 sec • 1 pt
Which data display is best for showing the spread and variation of a dataset?
Histogram
Box Plot
Dot Plot
Line Plot
Access all questions and much more by creating a free account
Create resources
Host any resource
Get auto-graded reports
Continue with Google

Continue with Email
Continue with Classlink
Continue with Clever
or continue with
Microsoft
%20(1).png)
Apple
Others
Already have an account?
Similar Resources on Wayground
Popular Resources on Wayground

15 questions
Fractions on a Number Line
Quiz
•
3rd Grade
10 questions
Probability Practice
Quiz
•
4th Grade
15 questions
Probability on Number LIne
Quiz
•
4th Grade
20 questions
Equivalent Fractions
Quiz
•
3rd Grade
25 questions
Multiplication Facts
Quiz
•
5th Grade
22 questions
fractions
Quiz
•
3rd Grade
6 questions
Appropriate Chromebook Usage
Lesson
•
7th Grade
10 questions
Greek Bases tele and phon
Quiz
•
6th - 8th Grade
Discover more resources for Mathematics
20 questions
Writing Algebraic Expressions
Quiz
•
6th Grade
20 questions
Ratios/Rates and Unit Rates
Quiz
•
6th Grade
14 questions
Volume of rectangular prisms
Quiz
•
7th Grade
15 questions
Graphing Inequalities
Quiz
•
7th - 9th Grade
20 questions
Graphing Inequalities on a Number Line
Quiz
•
6th - 9th Grade
20 questions
One Step Equations
Quiz
•
6th Grade
12 questions
One-Step Equations
Quiz
•
6th Grade
6 questions
Equations from models
Quiz
•
6th Grade