Best Fit Line Analysis
Interactive Video
•
Mathematics
•
9th - 10th Grade
•
Practice Problem
•
Hard

Lucas Foster
FREE Resource
Read more
6 questions
Show all answers
1.
MULTIPLE CHOICE QUESTION
30 sec • 1 pt
What is the first step in determining the best model for the data in the graph?
Identifying the Y-intercept
Calculating the mean
Finding the median
Identifying the slope
2.
MULTIPLE CHOICE QUESTION
30 sec • 1 pt
Why are options with negative slopes eliminated?
They are not mathematically valid
They are not visually appealing
They are more complex to calculate
They do not fit the data as well
3.
MULTIPLE CHOICE QUESTION
30 sec • 1 pt
What are the two Y-intercept options considered in the video?
+3 and -3
+2 and -2
+4 and -4
+1 and -1
4.
MULTIPLE CHOICE QUESTION
30 sec • 1 pt
Which Y-intercept aligns better with the data according to the video?
+3
+2
-2
-3
5.
MULTIPLE CHOICE QUESTION
30 sec • 1 pt
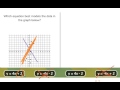
What is the final equation chosen as the best fit for the graph?
y = 3x + 2
y = 4x - 2
y = 5x - 1
y = 2x + 3
6.
MULTIPLE CHOICE QUESTION
30 sec • 1 pt
Why is the equation y = 4x - 2 considered the best fit?
It has the highest slope
It passes through the most data points
It is the simplest equation
It has the lowest Y-intercept
Access all questions and much more by creating a free account
Create resources
Host any resource
Get auto-graded reports
Continue with Google

Continue with Email
Continue with Classlink
Continue with Clever
or continue with
Microsoft
%20(1).png)
Apple
Others
Already have an account?
