Analyzing Scatter Plots and Relationships
Interactive Video
•
Mathematics
•
6th - 7th Grade
•
Practice Problem
•
Hard

Lucas Foster
FREE Resource
Read more
10 questions
Show all answers
1.
MULTIPLE CHOICE QUESTION
30 sec • 1 pt
What is the primary purpose of creating a scatter plot in this context?
To calculate the total number of visitors
To find the highest temperature recorded
To determine the average temperature
To analyze the relationship between temperature and beach visitors
2.
MULTIPLE CHOICE QUESTION
30 sec • 1 pt
Which variable is considered the independent variable in this scatter plot?
Number of visitors
Temperature
Time of day
Day of the week
3.
MULTIPLE CHOICE QUESTION
30 sec • 1 pt
On which axis is the number of beach visitors plotted?
X-axis
Y-axis
Z-axis
None of the above
4.
MULTIPLE CHOICE QUESTION
30 sec • 1 pt
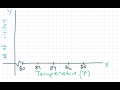
What is the starting point for the x-axis scale in the scatter plot?
90 degrees
80 degrees
70 degrees
0 degrees
5.
MULTIPLE CHOICE QUESTION
30 sec • 1 pt
What is the maximum value labeled on the y-axis?
300
200
100
400
6.
MULTIPLE CHOICE QUESTION
30 sec • 1 pt
Where would you plot a temperature of 83 degrees and 150 visitors?
At the intersection of 85 on the x-axis and 200 on the y-axis
At the intersection of 80 on the x-axis and 150 on the y-axis
At the intersection of 83 on the x-axis and 150 on the y-axis
At the intersection of 83 on the x-axis and 100 on the y-axis
7.
MULTIPLE CHOICE QUESTION
30 sec • 1 pt
Which data point represents a temperature of 86 degrees and 175 visitors?
(85, 175)
(86, 150)
(87, 175)
(86, 175)
Access all questions and much more by creating a free account
Create resources
Host any resource
Get auto-graded reports
Continue with Google

Continue with Email
Continue with Classlink
Continue with Clever
or continue with
Microsoft
%20(1).png)
Apple
Others
Already have an account?
