Analyzing Superhero Preferences Data
Interactive Video
•
Mathematics
•
9th - 10th Grade
•
Practice Problem
•
Hard

Lucas Foster
FREE Resource
Read more
7 questions
Show all answers
1.
MULTIPLE CHOICE QUESTION
30 sec • 1 pt
What is the main focus of the data collected in the video?
Favorite movie genres
Marvel comic book preferences
Favorite DC comic book superheroes
Preferred sports activities
2.
MULTIPLE CHOICE QUESTION
30 sec • 1 pt
Which superhero's preference is being analyzed for relative frequency?
The Flash
Superman
Wonder Woman
Batman
3.
MULTIPLE CHOICE QUESTION
30 sec • 1 pt
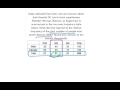
How many people in total prefer Batman according to the table?
75
63
100
50
4.
MULTIPLE CHOICE QUESTION
30 sec • 1 pt
What is the total number of people surveyed for all superheroes?
300
250
200
150
5.
MULTIPLE CHOICE QUESTION
30 sec • 1 pt
What is the simplified decimal representation of the relative frequency for Batman?
0.250
0.315
0.400
0.500
6.
MULTIPLE CHOICE QUESTION
30 sec • 1 pt
What is the first step in simplifying the fraction 63/200?
Subtract 5 from both numbers
Add 10 to both numbers
Divide both numbers by 2
Multiply both numbers by 2
7.
MULTIPLE CHOICE QUESTION
30 sec • 1 pt
To what decimal place is the final answer rounded?
Thousandth
Tenth
Hundredth
Whole number
Access all questions and much more by creating a free account
Create resources
Host any resource
Get auto-graded reports
Continue with Google

Continue with Email
Continue with Classlink
Continue with Clever
or continue with
Microsoft
%20(1).png)
Apple
Others
Already have an account?
Similar Resources on Wayground
Popular Resources on Wayground

7 questions
History of Valentine's Day
Interactive video
•
4th Grade
15 questions
Fractions on a Number Line
Quiz
•
3rd Grade
20 questions
Equivalent Fractions
Quiz
•
3rd Grade
25 questions
Multiplication Facts
Quiz
•
5th Grade
22 questions
fractions
Quiz
•
3rd Grade
15 questions
Valentine's Day Trivia
Quiz
•
3rd Grade
20 questions
Main Idea and Details
Quiz
•
5th Grade
20 questions
Context Clues
Quiz
•
6th Grade
Discover more resources for Mathematics
20 questions
Graphing Inequalities on a Number Line
Quiz
•
6th - 9th Grade
20 questions
Exponent Properties
Quiz
•
9th Grade
15 questions
Combine Like Terms and Distributive Property
Quiz
•
8th - 9th Grade
20 questions
Function or Not a Function
Quiz
•
8th - 9th Grade
10 questions
Factor Quadratic Expressions with Various Coefficients
Quiz
•
9th - 12th Grade
10 questions
Elijah McCoy: Innovations and Impact in Black History
Interactive video
•
6th - 10th Grade
21 questions
Factoring Trinomials (a=1)
Quiz
•
9th Grade
5 questions
Triangle Congruence Theorems
Interactive video
•
9th - 12th Grade