Understanding Slope and Graphs
Interactive Video
•
Mathematics
•
9th - 10th Grade
•
Practice Problem
•
Hard

Emma Peterson
FREE Resource
Read more
10 questions
Show all answers
1.
MULTIPLE CHOICE QUESTION
30 sec • 1 pt
What is Erica trying to estimate using the graph?
The maximum value of the graph
The average rate of change over an interval
The minimum value of the graph
The total area under the graph
2.
MULTIPLE CHOICE QUESTION
30 sec • 1 pt
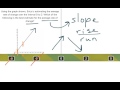
What does the slope of a line represent?
The angle of the line with the x-axis
The total length of the line
The rate of change or steepness of the line
The color of the line
3.
MULTIPLE CHOICE QUESTION
30 sec • 1 pt
What happens to a line with a negative slope?
It remains horizontal
It forms a vertical line
It goes down to the right
It goes up to the right
4.
MULTIPLE CHOICE QUESTION
30 sec • 1 pt
Why can a slope of zero be eliminated as an option?
Because the line is diagonal
Because the line is curved
Because the line is horizontal
Because the line is vertical
5.
MULTIPLE CHOICE QUESTION
30 sec • 1 pt
If a line has a slope of 5, what would it look like?
It would be a slightly inclined line
It would be a curved line
It would be a flat line
It would be a very steep line
6.
MULTIPLE CHOICE QUESTION
30 sec • 1 pt
What is the rise over run for a slope of 2?
Rise of 1 for every run of 3
Rise of 3 for every run of 1
Rise of 2 for every run of 1
Rise of 1 for every run of 2
7.
MULTIPLE CHOICE QUESTION
30 sec • 1 pt
What is the starting point of the graph in the interval 0 to 2?
At 3
At 0
At 2
At 1
Access all questions and much more by creating a free account
Create resources
Host any resource
Get auto-graded reports
Continue with Google

Continue with Email
Continue with Classlink
Continue with Clever
or continue with
Microsoft
%20(1).png)
Apple
Others
Already have an account?
