Understanding Percentiles and Integrals
Interactive Video
•
Mathematics
•
11th - 12th Grade
•
Practice Problem
•
Hard

Amelia Wright
FREE Resource
Read more
10 questions
Show all answers
1.
MULTIPLE CHOICE QUESTION
30 sec • 1 pt
What is the primary purpose of using percentiles in data analysis?
To calculate the mean of a dataset
To rank data points relative to each other
To compare data points with a standard deviation
To divide data into two equal parts
2.
MULTIPLE CHOICE QUESTION
30 sec • 1 pt
How does a median differ from a quartile?
A median is always larger than a quartile
A median divides data into three parts, while a quartile divides it into four
A median is used only in probability density functions
A median is a type of quartile that divides data into two equal parts
3.
MULTIPLE CHOICE QUESTION
30 sec • 1 pt
What percentile is equivalent to the first quartile?
75th percentile
50th percentile
25th percentile
10th percentile
4.
MULTIPLE CHOICE QUESTION
30 sec • 1 pt
In the context of the ATAR, what does a score of 99 indicate?
The student scored higher than 99% of the cohort
The student scored lower than 99% of the cohort
The student is in the top 1% of the cohort
The student is in the bottom 1% of the cohort
5.
MULTIPLE CHOICE QUESTION
30 sec • 1 pt
What is the significance of the 85th percentile in a dataset?
It indicates the score below which 85% of the data falls
It is the median score of the dataset
It indicates the score above which 85% of the data falls
It is the average score of the dataset
6.
MULTIPLE CHOICE QUESTION
30 sec • 1 pt
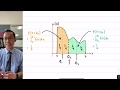
How is the 85th percentile represented in a probability density function?
As the point where 85% of the area under the curve is to the right
As the point where 85% of the area under the curve is to the left
As the midpoint of the curve
As the point where the curve is highest
7.
MULTIPLE CHOICE QUESTION
30 sec • 1 pt
What is the first step in calculating the 85th percentile using integrals?
Set up an integral from the lower boundary to the 85th percentile
Find the standard deviation of the dataset
Identify the median of the dataset
Calculate the mean of the dataset
Access all questions and much more by creating a free account
Create resources
Host any resource
Get auto-graded reports
Continue with Google

Continue with Email
Continue with Classlink
Continue with Clever
or continue with
Microsoft
%20(1).png)
Apple
Others
Already have an account?
