Graph Interpretation and Temperature Analysis
Interactive Video
•
Science
•
6th - 7th Grade
•
Practice Problem
•
Hard

Thomas White
FREE Resource
Read more
10 questions
Show all answers
1.
MULTIPLE CHOICE QUESTION
30 sec • 1 pt
What is the main reason the instructor uses different programs for solving practice tests?
To avoid using a calculator
To use more advanced technology
To better illustrate questions with screen capture
To make the video more interesting
2.
MULTIPLE CHOICE QUESTION
30 sec • 1 pt
What was Rayota's homework assignment about?
Measuring rainfall
Graphing wind speed
Calculating humidity levels
Measuring and graphing temperature
3.
MULTIPLE CHOICE QUESTION
30 sec • 1 pt
When interpreting a graph, what should you first pay attention to?
The size of the graph
The title of the graph
The colors used
The axes and their labels
4.
MULTIPLE CHOICE QUESTION
30 sec • 1 pt
In the graph discussed, how does time progress?
From right to left
From top to bottom
From left to right
From bottom to top
5.
MULTIPLE CHOICE QUESTION
30 sec • 1 pt
What does a constant line on a graph indicate about temperature?
It fluctuates
It remains the same
It is decreasing
It is increasing
6.
MULTIPLE CHOICE QUESTION
30 sec • 1 pt
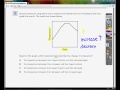
What pattern of temperature change is observed in the graph?
Decrease, constant, increase
Increase, constant, decrease
Increase, decrease, constant
Constant, increase, decrease
7.
MULTIPLE CHOICE QUESTION
30 sec • 1 pt
Which option was immediately ruled out based on the graph's pattern?
Temperature decreased, then increased
Temperature increased, then decreased
Temperature increased, then stayed constant
Temperature decreased, then stayed constant
Access all questions and much more by creating a free account
Create resources
Host any resource
Get auto-graded reports
Continue with Google

Continue with Email
Continue with Classlink
Continue with Clever
or continue with
Microsoft
%20(1).png)
Apple
Others
Already have an account?
Similar Resources on Wayground
Popular Resources on Wayground

15 questions
Fractions on a Number Line
Quiz
•
3rd Grade
10 questions
Probability Practice
Quiz
•
4th Grade
15 questions
Probability on Number LIne
Quiz
•
4th Grade
20 questions
Equivalent Fractions
Quiz
•
3rd Grade
25 questions
Multiplication Facts
Quiz
•
5th Grade
22 questions
fractions
Quiz
•
3rd Grade
6 questions
Appropriate Chromebook Usage
Lesson
•
7th Grade
10 questions
Greek Bases tele and phon
Quiz
•
6th - 8th Grade
Discover more resources for Science
6 questions
Appropriate Chromebook Usage
Lesson
•
7th Grade
20 questions
Rocks and The Rock Cycle
Quiz
•
6th Grade
42 questions
Academic Bowl Questions - Round 2
Quiz
•
7th Grade
10 questions
Exploring the Rock Cycle
Interactive video
•
6th - 8th Grade
12 questions
Ecological Succession
Quiz
•
7th Grade
8 questions
Newton's Second Law
Lesson
•
6th - 8th Grade
20 questions
Thermal Energy - Heat Transfer
Quiz
•
6th Grade
10 questions
Exploring the Rock Cycle: Types and Formation
Interactive video
•
6th - 8th Grade