Understanding Histograms and Data Distribution
Interactive Video
•
Mathematics
•
6th - 7th Grade
•
Practice Problem
•
Hard

Thomas White
FREE Resource
Read more
10 questions
Show all answers
1.
MULTIPLE CHOICE QUESTION
30 sec • 1 pt
What does a histogram primarily show?
The average of data points
The median of the data set
The sum of all data points
The frequency of data within intervals
2.
MULTIPLE CHOICE QUESTION
30 sec • 1 pt
How are data intervals represented in a histogram?
As lines
As bars
As dots
As circles
3.
MULTIPLE CHOICE QUESTION
30 sec • 1 pt
In the Main Street Park tree ages histogram, what does a taller bar indicate?
More trees were planted in that age range
Fewer trees were removed
The trees are older
The trees are younger
4.
MULTIPLE CHOICE QUESTION
30 sec • 1 pt
What might a short bar in a histogram indicate?
A low frequency of data
A high frequency of data
A missing data point
An error in data collection
5.
MULTIPLE CHOICE QUESTION
30 sec • 1 pt
What conclusion can be drawn from the student pets histogram?
All students have the same number of pets
No students have pets
Having two or three pets is common
Most students have more than three pets
6.
MULTIPLE CHOICE QUESTION
30 sec • 1 pt
In the context of histograms, what does the term 'distribution' refer to?
The total number of data points
The spread of data across intervals
The highest data point
The average value of data
7.
MULTIPLE CHOICE QUESTION
30 sec • 1 pt
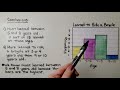
According to the bicycle learning ages histogram, at what age do most children learn to ride a bicycle?
Eleven or twelve years old
Three or four years old
Five to eight years old
Nine or ten years old
Create a free account and access millions of resources
Create resources
Host any resource
Get auto-graded reports
Continue with Google

Continue with Email
Continue with Classlink
Continue with Clever
or continue with
Microsoft
%20(1).png)
Apple
Others
Already have an account?
Popular Resources on Wayground

10 questions
Honoring the Significance of Veterans Day
Interactive video
•
6th - 10th Grade
9 questions
FOREST Community of Caring
Lesson
•
1st - 5th Grade
10 questions
Exploring Veterans Day: Facts and Celebrations for Kids
Interactive video
•
6th - 10th Grade
19 questions
Veterans Day
Quiz
•
5th Grade
14 questions
General Technology Use Quiz
Quiz
•
8th Grade
25 questions
Multiplication Facts
Quiz
•
5th Grade
15 questions
Circuits, Light Energy, and Forces
Quiz
•
5th Grade
19 questions
Thanksgiving Trivia
Quiz
•
6th Grade
Discover more resources for Mathematics
20 questions
Percent of a Number
Quiz
•
6th Grade
21 questions
Convert Fractions, Decimals, and Percents
Quiz
•
6th Grade
20 questions
One step Equations
Quiz
•
6th Grade
20 questions
Unit Rate
Quiz
•
6th Grade
20 questions
Adding and Subtracting Integers
Quiz
•
6th Grade
15 questions
5.4 The Distributive Property
Quiz
•
6th Grade
15 questions
Equivalent Ratios
Quiz
•
6th Grade
20 questions
Solving Proportions
Quiz
•
5th - 7th Grade