Analyzing Trends in Graphs
Interactive Video
•
Mathematics
•
9th - 10th Grade
•
Practice Problem
•
Hard

Patricia Brown
FREE Resource
Read more
10 questions
Show all answers
1.
MULTIPLE CHOICE QUESTION
30 sec • 1 pt
What is one benefit of analyzing trends in graphs?
To hide data
To confuse the audience
To predict future events
To create artistic designs
2.
MULTIPLE CHOICE QUESTION
30 sec • 1 pt
What was the estimated population of Australia in 2020 based on the graph?
26 million
22 million
24 million
20 million
3.
MULTIPLE CHOICE QUESTION
30 sec • 1 pt
How did the Australian population trend from 1945 to 2000?
It remained constant
It decreased steadily
It fluctuated randomly
It increased steadily
4.
MULTIPLE CHOICE QUESTION
30 sec • 1 pt
What trend was observed in the NASA budget as a percentage of the federal budget?
It fluctuated randomly
It was decreasing steadily
It remained constant
It was increasing steadily
5.
MULTIPLE CHOICE QUESTION
30 sec • 1 pt
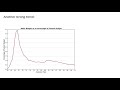
Why is it difficult to predict crude oil prices in Texas from 2007 to 2009?
The prices were stable
There was a sharp increase followed by a decrease
The prices were increasing steadily
The prices were decreasing steadily
6.
MULTIPLE CHOICE QUESTION
30 sec • 1 pt
What is a weak trend in the context of graph analysis?
A trend that follows a clear pattern
A trend that does not follow a clear pattern
A trend that is always increasing
A trend that is always decreasing
7.
MULTIPLE CHOICE QUESTION
30 sec • 1 pt
What is a potential risk when relying on strong trends for predictions?
They can change unexpectedly
They are too complex to understand
They require no analysis
They are always accurate
Access all questions and much more by creating a free account
Create resources
Host any resource
Get auto-graded reports
Continue with Google

Continue with Email
Continue with Classlink
Continue with Clever
or continue with
Microsoft
%20(1).png)
Apple
Others
Already have an account?
