Graphing Data and Trend Lines
Interactive Video
•
Physics
•
9th - 10th Grade
•
Practice Problem
•
Hard

Patricia Brown
FREE Resource
Read more
10 questions
Show all answers
1.
MULTIPLE CHOICE QUESTION
30 sec • 1 pt
What is the primary purpose of graphing the data from the Charles's law micro lab?
To determine the value of absolute zero
To calculate the density of a gas
To find the boiling point of water
To measure the speed of sound
2.
MULTIPLE CHOICE QUESTION
30 sec • 1 pt
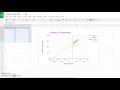
Which type of chart is recommended for graphing the data in this tutorial?
Line chart
Pie chart
Bar chart
Scatter chart
3.
MULTIPLE CHOICE QUESTION
30 sec • 1 pt
What is the benefit of labeling the axes before inserting the chart?
It automatically colors the chart
It ensures the axes are labeled in the chart
It changes the chart type to a scatter chart
It increases the chart's size
4.
MULTIPLE CHOICE QUESTION
30 sec • 1 pt
Which font is chosen for the chart's legend in the tutorial?
Arial
Calibri
Times New Roman
Georgia
5.
MULTIPLE CHOICE QUESTION
30 sec • 1 pt
What is the maximum value set for the y-axis in the tutorial?
100
150
200
250
6.
MULTIPLE CHOICE QUESTION
30 sec • 1 pt
What is the significance of setting the x-axis minimum value to 300?
To help find absolute zero
To find the boiling point of water
To make the graph symmetrical
To align with the y-axis
7.
MULTIPLE CHOICE QUESTION
30 sec • 1 pt
How often are grid lines added to the chart?
Every 20 units
Every 5 units
Every 15 units
Every 10 units
Access all questions and much more by creating a free account
Create resources
Host any resource
Get auto-graded reports
Continue with Google

Continue with Email
Continue with Classlink
Continue with Clever
or continue with
Microsoft
%20(1).png)
Apple
Others
Already have an account?
