Understanding Scatter Plots and Relationships
Interactive Video
•
Mathematics
•
6th - 7th Grade
•
Practice Problem
•
Hard

Patricia Brown
FREE Resource
Read more
10 questions
Show all answers
1.
MULTIPLE CHOICE QUESTION
30 sec • 1 pt
What is the primary purpose of a scatter plot?
To display the frequency of data points
To show the relationship between two variables
To calculate the average of data points
To list data points in a table
2.
MULTIPLE CHOICE QUESTION
30 sec • 1 pt
When plotting a scatter plot, what does the x-axis typically represent?
The sum of the data
The dependent variable
The average of the data
The independent variable
3.
MULTIPLE CHOICE QUESTION
30 sec • 1 pt
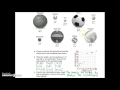
What is the main takeaway from the scatter plot activity involving sports balls?
Lighter balls always have larger circumferences
Heavier balls always have smaller circumferences
There is no discernible pattern between weight and circumference
There is a general trend where heavier balls have larger circumferences
4.
MULTIPLE CHOICE QUESTION
30 sec • 1 pt
How can you describe a positive relationship in a scatter plot?
The points form a horizontal line
The points go downwards to the right
The points go upwards to the right
The points are scattered randomly
5.
MULTIPLE CHOICE QUESTION
30 sec • 1 pt
What does it mean if a scatter plot shows a linear relationship?
The points form a circular pattern
The points generally follow a straight path
The points form a perfect straight line
The points are scattered with no pattern
6.
MULTIPLE CHOICE QUESTION
30 sec • 1 pt
Why does the bowling ball not fit the pattern in the scatter plot?
It is lighter than other balls
It is the same size as other balls
It has a much heavier weight
It has a much larger circumference
7.
MULTIPLE CHOICE QUESTION
30 sec • 1 pt
In the context of student absences and grades, what does a negative relationship indicate?
More absences lead to higher grades
More absences have no effect on grades
Absences and grades are unrelated
More absences lead to lower grades
Access all questions and much more by creating a free account
Create resources
Host any resource
Get auto-graded reports
Continue with Google

Continue with Email
Continue with Classlink
Continue with Clever
or continue with
Microsoft
%20(1).png)
Apple
Others
Already have an account?
