Science Fair Project Data Analysis
Interactive Video
•
Biology
•
6th - 8th Grade
•
Practice Problem
•
Hard

Patricia Brown
FREE Resource
Read more
10 questions
Show all answers
1.
MULTIPLE CHOICE QUESTION
30 sec • 1 pt
What is the primary example used to demonstrate creating a science fair table and graph?
Tomato plants with different fertilizers
Bean plants with different watering schedules
Cactus growth in different soil types
Sunflower growth with various sunlight levels
2.
MULTIPLE CHOICE QUESTION
30 sec • 1 pt
What is the nitrogen percentage in the first fertilizer used in the example?
0%
10%
5%
2.5%
3.
MULTIPLE CHOICE QUESTION
30 sec • 1 pt
Which software is used to create and format the table for the science fair project?
LibreOffice Calc
Microsoft Excel
Apple Numbers
Google Sheets
4.
MULTIPLE CHOICE QUESTION
30 sec • 1 pt
What is the purpose of adding borders and shading to the table in Word?
To increase the size of the table
To make the table colorful
To highlight important data
To make the table neat and organized
5.
MULTIPLE CHOICE QUESTION
30 sec • 1 pt
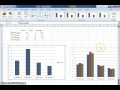
What type of graph is created from the table data?
Scatter plot
Line graph
Pie chart
Column graph
6.
MULTIPLE CHOICE QUESTION
30 sec • 1 pt
Why is it beneficial to use averages when creating the graph?
It simplifies the data presentation
It allows for more data points
It makes the graph more colorful
It reduces the size of the graph
7.
MULTIPLE CHOICE QUESTION
30 sec • 1 pt
What is the title of the graph that combines the X and Y axes information?
Nitrogen Levels in Fertilizers
Growth Patterns of Tomato Plants
Tomato Plant Growth with Different Percentages of Nitrogen Fertilizer
Happy Plants
Access all questions and much more by creating a free account
Create resources
Host any resource
Get auto-graded reports
Continue with Google

Continue with Email
Continue with Classlink
Continue with Clever
or continue with
Microsoft
%20(1).png)
Apple
Others
Already have an account?
Popular Resources on Wayground

15 questions
Fractions on a Number Line
Quiz
•
3rd Grade
20 questions
Equivalent Fractions
Quiz
•
3rd Grade
25 questions
Multiplication Facts
Quiz
•
5th Grade
54 questions
Analyzing Line Graphs & Tables
Quiz
•
4th Grade
22 questions
fractions
Quiz
•
3rd Grade
20 questions
Main Idea and Details
Quiz
•
5th Grade
20 questions
Context Clues
Quiz
•
6th Grade
15 questions
Equivalent Fractions
Quiz
•
4th Grade
Discover more resources for Biology
20 questions
Adaptations and Natural Selection
Quiz
•
7th Grade
10 questions
Comparing Mitosis and Meiosis: Key Differences and Stages
Interactive video
•
6th - 10th Grade
14 questions
Reading Comprehension SC.7.L.15.1
Passage
•
8th Grade
10 questions
Cell Structure and Function Concepts
Interactive video
•
6th - 10th Grade
10 questions
Natural Selection and Adaptation in Evolution
Interactive video
•
6th - 10th Grade
16 questions
Plant Vs. Animal Cells
Quiz
•
6th Grade
15 questions
Pedigrees
Quiz
•
7th - 12th Grade
20 questions
Cell Organelles
Quiz
•
7th Grade