Understanding Climographs and Climate Patterns
Interactive Video
•
Geography
•
9th - 10th Grade
•
Practice Problem
•
Hard

Patricia Brown
FREE Resource
Read more
7 questions
Show all answers
1.
MULTIPLE CHOICE QUESTION
30 sec • 1 pt
What is a climograph primarily used for?
Mapping geographical locations
Tracking stock market trends
Studying weather and climate patterns
Analyzing population growth
2.
MULTIPLE CHOICE QUESTION
30 sec • 1 pt
Which component of a climograph is used to display precipitation?
Scatter plot
Pie chart
Line graph
Bar graph
3.
MULTIPLE CHOICE QUESTION
30 sec • 1 pt
How is temperature typically represented in a climograph?
Using a bar graph
With a line graph and dots
Through a pie chart
By a scatter plot
4.
MULTIPLE CHOICE QUESTION
30 sec • 1 pt
What can be determined by analyzing the temperature range in a climograph?
The average rainfall
The population density
The stock market trends
The average temperature range for the year
5.
MULTIPLE CHOICE QUESTION
30 sec • 1 pt
What additional information can be inferred when precipitation data is combined with temperature data in a climograph?
The economic status of the region
The political boundaries
The climatic condition of the area
The type of soil in the region
6.
MULTIPLE CHOICE QUESTION
30 sec • 1 pt
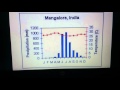
In the case study of India, what climatic condition is indicated by the climograph?
Monsoon climate
Tundra climate
Desert climate
Mediterranean climate
7.
MULTIPLE CHOICE QUESTION
30 sec • 1 pt
During which months does the climograph for India show a peak in rainfall?
October to December
April to June
January to March
June to September
Access all questions and much more by creating a free account
Create resources
Host any resource
Get auto-graded reports
Continue with Google

Continue with Email
Continue with Classlink
Continue with Clever
or continue with
Microsoft
%20(1).png)
Apple
Others
Already have an account?
