Understanding Sankey Diagrams
Interactive Video
•
Physics
•
9th - 10th Grade
•
Practice Problem
•
Hard

Patricia Brown
FREE Resource
Read more
10 questions
Show all answers
1.
MULTIPLE CHOICE QUESTION
30 sec • 1 pt
What is the main purpose of this video?
To explain the history of Sankey diagrams
To teach how to draw a perfect Sankey diagram
To discuss the advantages of Sankey diagrams
To compare different types of energy diagrams
2.
MULTIPLE CHOICE QUESTION
30 sec • 1 pt
Which component of a Sankey diagram represents the energy being put into the system?
Output energy
Input energy
Useful energy
Wasted energy
3.
MULTIPLE CHOICE QUESTION
30 sec • 1 pt
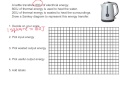
In the kettle example, how much electrical energy is transferred?
200 Joules
800 Joules
1000 Joules
600 Joules
4.
MULTIPLE CHOICE QUESTION
30 sec • 1 pt
What is the first step in drawing a Sankey diagram?
Decide on the scales
Add labels
Plot the input energy
Plot the wasted energy
5.
MULTIPLE CHOICE QUESTION
30 sec • 1 pt
How many squares represent 800 Joules of input energy in the example?
8 squares
4 squares
6 squares
10 squares
6.
MULTIPLE CHOICE QUESTION
30 sec • 1 pt
What direction do the arrows for wasted energy point in a Sankey diagram?
To the right
To the left
Upwards
Downwards
7.
MULTIPLE CHOICE QUESTION
30 sec • 1 pt
How many squares represent the useful energy output of 600 Joules?
4 squares
7 squares
5 squares
6 squares
Access all questions and much more by creating a free account
Create resources
Host any resource
Get auto-graded reports
Continue with Google

Continue with Email
Continue with Classlink
Continue with Clever
or continue with
Microsoft
%20(1).png)
Apple
Others
Already have an account?
