Histogram and Data Interpretation
Interactive Video
•
Mathematics
•
6th - 8th Grade
•
Practice Problem
•
Hard

Patricia Brown
FREE Resource
Read more
10 questions
Show all answers
1.
MULTIPLE CHOICE QUESTION
30 sec • 1 pt
What is a histogram primarily used for?
Comparing two datasets
Displaying numerical data in ranges
Representing categorical data
Showing trends over time
2.
MULTIPLE CHOICE QUESTION
30 sec • 1 pt
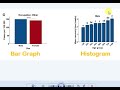
How does a histogram differ from a bar graph?
Histograms are used for time series data
Bar graphs are always vertical, histograms are horizontal
Histograms display data in ranges, bar graphs use categories
Histograms use colors, bar graphs do not
3.
MULTIPLE CHOICE QUESTION
30 sec • 1 pt
In which scenario would you use a bar graph?
To display the weight range of dogs
To compare the number of cases in different countries
To show the distribution of ages in a population
To analyze the frequency of test scores
4.
MULTIPLE CHOICE QUESTION
30 sec • 1 pt
What does the height of a bar in a histogram represent?
The maximum value in the dataset
The average value of the data
The frequency of data within a range
The total number of data points
5.
MULTIPLE CHOICE QUESTION
30 sec • 1 pt
Which range of pages is most common in the given histogram?
101 to 120 pages
81 to 100 pages
21 to 40 pages
1 to 20 pages
6.
MULTIPLE CHOICE QUESTION
30 sec • 1 pt
How many amusement parks have between 15 and 19 roller coasters?
10 parks
15 parks
25 parks
20 parks
7.
MULTIPLE CHOICE QUESTION
30 sec • 1 pt
What is the total number of students who took the quiz?
40 students
30 students
24 students
34 students
Access all questions and much more by creating a free account
Create resources
Host any resource
Get auto-graded reports
Continue with Google

Continue with Email
Continue with Classlink
Continue with Clever
or continue with
Microsoft
%20(1).png)
Apple
Others
Already have an account?
Similar Resources on Wayground
Popular Resources on Wayground

7 questions
History of Valentine's Day
Interactive video
•
4th Grade
15 questions
Fractions on a Number Line
Quiz
•
3rd Grade
20 questions
Equivalent Fractions
Quiz
•
3rd Grade
25 questions
Multiplication Facts
Quiz
•
5th Grade
22 questions
fractions
Quiz
•
3rd Grade
15 questions
Valentine's Day Trivia
Quiz
•
3rd Grade
20 questions
Main Idea and Details
Quiz
•
5th Grade
20 questions
Context Clues
Quiz
•
6th Grade
Discover more resources for Mathematics
20 questions
Writing Algebraic Expressions
Quiz
•
6th Grade
20 questions
Ratios/Rates and Unit Rates
Quiz
•
6th Grade
14 questions
Volume of rectangular prisms
Quiz
•
7th Grade
20 questions
Laws of Exponents
Quiz
•
8th Grade
20 questions
Graphing Inequalities on a Number Line
Quiz
•
6th - 9th Grade
20 questions
One Step Equations
Quiz
•
6th Grade
10 questions
Solving One Step Inequalities
Quiz
•
6th Grade
15 questions
Equivalent Ratios
Quiz
•
6th Grade