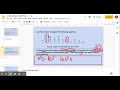
Analyzing Student Homework Data
Interactive Video
•
Mathematics, English, Other
•
6th - 7th Grade
•
Practice Problem
•
Hard

Thomas White
FREE Resource
Read more
10 questions
Show all answers
1.
MULTIPLE CHOICE QUESTION
30 sec • 1 pt
What is the main problem being addressed in the video?
Determining a good description of the number of hours students spend on homework per week.
Finding the average number of hours students spend on homework.
Calculating the total number of hours all students spend on homework.
Identifying the student who spends the most time on homework.
2.
MULTIPLE CHOICE QUESTION
30 sec • 1 pt
What is the total number of students in the group?
25 students
20 students
35 students
30 students
3.
MULTIPLE CHOICE QUESTION
30 sec • 1 pt
Why is six hours per week not considered a good description for the group?
Because all students spend exactly six hours on homework.
Because only three students spend six hours on homework.
Because six hours is the maximum time any student spends on homework.
Because six hours is the average time spent by all students.
4.
MULTIPLE CHOICE QUESTION
30 sec • 1 pt
How many students spend more than six hours on homework per week?
Half of the students
No students
All students
A couple of students
5.
MULTIPLE CHOICE QUESTION
30 sec • 1 pt
How many students spend one hour per week on homework?
Ten students
Five students
Three students
Fifteen students
6.
MULTIPLE CHOICE QUESTION
30 sec • 1 pt
Why is one hour per week not a good description for the group?
Because it is the average time spent by all students.
Because only five students spend one hour on homework.
Because all students spend more than one hour on homework.
Because one hour is the minimum time any student spends on homework.
7.
MULTIPLE CHOICE QUESTION
30 sec • 1 pt
What is the relationship between summarizing a story and analyzing the dot plot?
Both are about finding a good summary of key details.
Both involve finding the longest details.
Both require identifying the most common elements.
Both focus on the least important details.
Access all questions and much more by creating a free account
Create resources
Host any resource
Get auto-graded reports
Continue with Google

Continue with Email
Continue with Classlink
Continue with Clever
or continue with
Microsoft
%20(1).png)
Apple
Others
Already have an account?
Popular Resources on Wayground

15 questions
Fractions on a Number Line
Quiz
•
3rd Grade
20 questions
Equivalent Fractions
Quiz
•
3rd Grade
25 questions
Multiplication Facts
Quiz
•
5th Grade
54 questions
Analyzing Line Graphs & Tables
Quiz
•
4th Grade
22 questions
fractions
Quiz
•
3rd Grade
20 questions
Main Idea and Details
Quiz
•
5th Grade
20 questions
Context Clues
Quiz
•
6th Grade
15 questions
Equivalent Fractions
Quiz
•
4th Grade
Discover more resources for Mathematics
22 questions
distributive property
Quiz
•
7th Grade
18 questions
Angle Relationships
Quiz
•
7th Grade
15 questions
Distributive Property & Review
Quiz
•
6th Grade
20 questions
Writing Algebraic Expressions
Quiz
•
6th Grade
20 questions
How Some Friendships Last — and Others Don’t Video Questions
Quiz
•
7th Grade
20 questions
Ratios/Rates and Unit Rates
Quiz
•
6th Grade
18 questions
Handbook Refresher Quiz
Quiz
•
7th Grade
20 questions
Graphing Inequalities on a Number Line
Quiz
•
6th - 9th Grade