Temperature Variability and Mean Analysis
Interactive Video
•
Mathematics
•
6th - 7th Grade
•
Practice Problem
•
Hard

Thomas White
FREE Resource
Read more
10 questions
Show all answers
1.
MULTIPLE CHOICE QUESTION
30 sec • 1 pt
Why is it important to consider variability in a data distribution?
It helps in understanding the spread of data.
It is not important; only the mean matters.
Variability is only relevant for large data sets.
It complicates the analysis unnecessarily.
2.
MULTIPLE CHOICE QUESTION
30 sec • 1 pt
What surprised Robert about the climate in San Francisco?
It was similar to New York's climate.
It was cooler than he anticipated.
It was much warmer than he expected.
It had more rainfall than he thought.
3.
MULTIPLE CHOICE QUESTION
30 sec • 1 pt
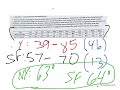
What is the average temperature range in San Francisco according to the data?
50 to 80 degrees
39 to 85 degrees
57 to 70 degrees
60 to 90 degrees
4.
MULTIPLE CHOICE QUESTION
30 sec • 1 pt
How does the temperature variability in New York compare to San Francisco?
New York has less variability.
Both cities have the same variability.
San Francisco has more variability.
New York has more variability.
5.
MULTIPLE CHOICE QUESTION
30 sec • 1 pt
Why might the mean temperature be misleading for New York?
The mean is only accurate in winter.
The mean is too low.
The mean does not account for the wide range of temperatures.
The mean is too high.
6.
MULTIPLE CHOICE QUESTION
30 sec • 1 pt
What does the dot plot reveal about San Francisco's temperature data?
The temperatures are clustered around the mean.
The temperatures are widely spread.
The temperatures are mostly below the mean.
The temperatures are mostly above the mean.
7.
MULTIPLE CHOICE QUESTION
30 sec • 1 pt
In which city is the mean temperature a more accurate representation of the data?
New York City
San Francisco
Neither city
Both cities
Access all questions and much more by creating a free account
Create resources
Host any resource
Get auto-graded reports
Continue with Google

Continue with Email
Continue with Classlink
Continue with Clever
or continue with
Microsoft
%20(1).png)
Apple
Others
Already have an account?
Popular Resources on Wayground

15 questions
Fractions on a Number Line
Quiz
•
3rd Grade
20 questions
Equivalent Fractions
Quiz
•
3rd Grade
25 questions
Multiplication Facts
Quiz
•
5th Grade
29 questions
Alg. 1 Section 5.1 Coordinate Plane
Quiz
•
9th Grade
22 questions
fractions
Quiz
•
3rd Grade
11 questions
FOREST Effective communication
Lesson
•
KG
20 questions
Main Idea and Details
Quiz
•
5th Grade
20 questions
Context Clues
Quiz
•
6th Grade
Discover more resources for Mathematics
36 questions
6th Grade Math STAAR Review
Quiz
•
6th Grade
14 questions
Volume of rectangular prisms
Quiz
•
7th Grade
20 questions
Graphing Inequalities on a Number Line
Quiz
•
6th - 9th Grade
23 questions
Solve and Graph Inequalities
Quiz
•
6th Grade
15 questions
Distributive Property & Review
Quiz
•
6th Grade
10 questions
Mean, Median, Mode, and Range
Quiz
•
7th Grade
17 questions
Area of a parallelogram
Quiz
•
6th Grade
23 questions
Mean median mode and range
Quiz
•
7th Grade