Chirping Data and Statistical Analysis
Interactive Video
•
Mathematics
•
6th - 7th Grade
•
Practice Problem
•
Hard

Thomas White
FREE Resource
Read more
10 questions
Show all answers
1.
MULTIPLE CHOICE QUESTION
30 sec • 1 pt
What are the main objectives of using mean and mean absolute deviation in data analysis?
To calculate the exact scores of students
To describe data distribution in terms of center and variability
To determine the highest score in a dataset
To find the median of a dataset
2.
MULTIPLE CHOICE QUESTION
30 sec • 1 pt
If you scored 79 in Class A, where would you be in the distribution?
At the top of the class
In the middle of the data
Below average
Above average
3.
MULTIPLE CHOICE QUESTION
30 sec • 1 pt
Which class has more variability in scores?
Both have the same variability
Class B
Class A
Cannot be determined
4.
MULTIPLE CHOICE QUESTION
30 sec • 1 pt
Why might a high-scoring student prefer Class A?
Class B has more students
Class B has higher top scores
Class A has higher top scores
Class A has lower top scores
5.
MULTIPLE CHOICE QUESTION
30 sec • 1 pt
If you scored below average, which class might be preferable?
Class B, because it has a lower mean
Class A, because it has a higher mean
Class B, because scores are closer to the mean
Class A, because scores are more spread out
6.
MULTIPLE CHOICE QUESTION
30 sec • 1 pt
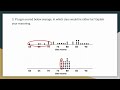
What is the purpose of creating dot plots for crickets and katydids?
To measure the size of insects
To find the average weight of insects
To determine the color of insects
To compare the number of chirps per minute
7.
MULTIPLE CHOICE QUESTION
30 sec • 1 pt
What is the mean number of chirps per minute for crickets?
30
35
40
45
Access all questions and much more by creating a free account
Create resources
Host any resource
Get auto-graded reports
Continue with Google

Continue with Email
Continue with Classlink
Continue with Clever
or continue with
Microsoft
%20(1).png)
Apple
Others
Already have an account?
Similar Resources on Wayground
Popular Resources on Wayground

7 questions
History of Valentine's Day
Interactive video
•
4th Grade
15 questions
Fractions on a Number Line
Quiz
•
3rd Grade
20 questions
Equivalent Fractions
Quiz
•
3rd Grade
25 questions
Multiplication Facts
Quiz
•
5th Grade
22 questions
fractions
Quiz
•
3rd Grade
15 questions
Valentine's Day Trivia
Quiz
•
3rd Grade
20 questions
Main Idea and Details
Quiz
•
5th Grade
20 questions
Context Clues
Quiz
•
6th Grade
Discover more resources for Mathematics
20 questions
Writing Algebraic Expressions
Quiz
•
6th Grade
20 questions
Ratios/Rates and Unit Rates
Quiz
•
6th Grade
14 questions
Volume of rectangular prisms
Quiz
•
7th Grade
20 questions
Graphing Inequalities on a Number Line
Quiz
•
6th - 9th Grade
20 questions
One Step Equations
Quiz
•
6th Grade
10 questions
Solving One Step Inequalities
Quiz
•
6th Grade
15 questions
Equivalent Ratios
Quiz
•
6th Grade
16 questions
2022 Winter Olympics Medal Table
Passage
•
6th - 8th Grade