NBA Arena Data Analysis
Interactive Video
•
Mathematics
•
6th - 7th Grade
•
Practice Problem
•
Hard

Thomas White
FREE Resource
Read more
10 questions
Show all answers
1.
MULTIPLE CHOICE QUESTION
30 sec • 1 pt
What is a key difference between a histogram and a bar graph?
Histograms use individual numbers on the x-axis.
Bar graphs have touching bars.
Bar graphs display data in percentages.
Histograms use ranges of numbers on the x-axis.
2.
MULTIPLE CHOICE QUESTION
30 sec • 1 pt
Why is relative frequency used instead of frequency in some cases?
To compare data sets of different sizes using percentages.
To make the data look more appealing.
To avoid using decimals.
To simplify the calculation process.
3.
MULTIPLE CHOICE QUESTION
30 sec • 1 pt
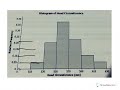
In the head circumference example, what is the relative frequency of a size range that appears 8 times out of 40?
0.20
0.25
0.15
0.08
4.
MULTIPLE CHOICE QUESTION
30 sec • 1 pt
How is the relative frequency calculated for a given size range?
By subtracting the frequency from the total number of observations.
By dividing the frequency by the total number of observations.
By multiplying the frequency by 100.
By adding the frequencies of all size ranges.
5.
MULTIPLE CHOICE QUESTION
30 sec • 1 pt
What percentage of the total does a size range represent if it appears 15 times out of 40?
50%
30%
25%
37.5%
6.
MULTIPLE CHOICE QUESTION
30 sec • 1 pt
In the NBA arena example, why are there only 29 arenas listed for 30 teams?
Two teams share the same arena.
One team plays in multiple arenas.
One team does not have an arena.
One arena is under construction.
7.
MULTIPLE CHOICE QUESTION
30 sec • 1 pt
What is the relative frequency of an arena seating range that appears once out of 29?
0.172
0.241
0.034
0.069
Access all questions and much more by creating a free account
Create resources
Host any resource
Get auto-graded reports
Continue with Google

Continue with Email
Continue with Classlink
Continue with Clever
or continue with
Microsoft
%20(1).png)
Apple
Others
Already have an account?
Similar Resources on Wayground
Popular Resources on Wayground

7 questions
History of Valentine's Day
Interactive video
•
4th Grade
15 questions
Fractions on a Number Line
Quiz
•
3rd Grade
20 questions
Equivalent Fractions
Quiz
•
3rd Grade
25 questions
Multiplication Facts
Quiz
•
5th Grade
22 questions
fractions
Quiz
•
3rd Grade
15 questions
Valentine's Day Trivia
Quiz
•
3rd Grade
20 questions
Main Idea and Details
Quiz
•
5th Grade
20 questions
Context Clues
Quiz
•
6th Grade
Discover more resources for Mathematics
20 questions
Writing Algebraic Expressions
Quiz
•
6th Grade
20 questions
Ratios/Rates and Unit Rates
Quiz
•
6th Grade
14 questions
Volume of rectangular prisms
Quiz
•
7th Grade
20 questions
Graphing Inequalities on a Number Line
Quiz
•
6th - 9th Grade
20 questions
One Step Equations
Quiz
•
6th Grade
10 questions
Solving One Step Inequalities
Quiz
•
6th Grade
15 questions
Equivalent Ratios
Quiz
•
6th Grade
16 questions
2022 Winter Olympics Medal Table
Passage
•
6th - 8th Grade