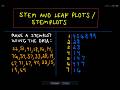
Understanding Stem and Leaf Plots
Interactive Video
•
Mathematics, Science, Other
•
9th - 10th Grade
•
Practice Problem
•
Hard

Patricia Brown
FREE Resource
Read more
10 questions
Show all answers
1.
MULTIPLE CHOICE QUESTION
30 sec • 1 pt
What is the primary purpose of a stem and leaf plot?
To calculate the mean of a dataset
To sort data in ascending order
To visually represent data for easier analysis
To find the median of a dataset
2.
MULTIPLE CHOICE QUESTION
30 sec • 1 pt
In a stem and leaf plot, what does the 'stem' represent?
The final digit of each data point
The average of the data points
The sum of all data points
All but the final digit of each data point
3.
MULTIPLE CHOICE QUESTION
30 sec • 1 pt
When creating a stem and leaf plot, how are the leaves arranged?
In descending order
In increasing order from the stem
Randomly
Grouped by even and odd numbers
4.
MULTIPLE CHOICE QUESTION
30 sec • 1 pt
What is the first step in creating a stem and leaf plot?
Calculating the mean
Separating each observation into a stem and a leaf
Sorting the data in descending order
Drawing a histogram
5.
MULTIPLE CHOICE QUESTION
30 sec • 1 pt
In the example dataset, which age group had the most smokers?
40 to 49
30 to 39
20 to 29
10 to 19
6.
MULTIPLE CHOICE QUESTION
30 sec • 1 pt
How are multiple entries of the same leaf value represented in a stem and leaf plot?
By writing the leaf value once
By writing the leaf value multiple times
By using a different symbol
By highlighting the leaf value
7.
MULTIPLE CHOICE QUESTION
30 sec • 1 pt
What should you do if there are no data points for a particular stem?
Use a placeholder symbol
Leave the row blank
Fill it with zeros
Remove the stem entirely
Access all questions and much more by creating a free account
Create resources
Host any resource
Get auto-graded reports
Continue with Google

Continue with Email
Continue with Classlink
Continue with Clever
or continue with
Microsoft
%20(1).png)
Apple
Others
Already have an account?
