Understanding Relationships in Graphs
Interactive Video
•
Science, Physics, Chemistry
•
9th - 10th Grade
•
Practice Problem
•
Hard

Patricia Brown
FREE Resource
Read more
10 questions
Show all answers
1.
MULTIPLE CHOICE QUESTION
30 sec • 1 pt
What is the first question you should ask when interpreting a graph?
What is the scale of the graph?
What are the units used?
What is the graph trying to tell me?
What is the graph's title?
2.
MULTIPLE CHOICE QUESTION
30 sec • 1 pt
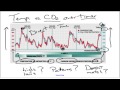
Which variable is represented in red on the graph?
Time
CO2 concentration
Pressure
Temperature
3.
MULTIPLE CHOICE QUESTION
30 sec • 1 pt
What unit is used for measuring CO2 concentration in the graph?
Liters
Parts per million
KiloPascals
Degrees Fahrenheit
4.
MULTIPLE CHOICE QUESTION
30 sec • 1 pt
How does the temperature scale on the graph increase?
From positive to negative
From negative to positive
From zero to positive
From zero to negative
5.
MULTIPLE CHOICE QUESTION
30 sec • 1 pt
What is a direct relationship in the context of the graph?
When one variable remains constant
When both variables increase or decrease together
When one variable increases, the other decreases
When variables are unrelated
6.
MULTIPLE CHOICE QUESTION
30 sec • 1 pt
What is an outlier in a data set?
A data point that is the average
A data point that does not fit the pattern
A data point that is the median
A data point that fits the pattern
7.
MULTIPLE CHOICE QUESTION
30 sec • 1 pt
What kind of relationship is shown when pressure increases and volume decreases?
Direct relationship
Inverse relationship
No relationship
Constant relationship
Access all questions and much more by creating a free account
Create resources
Host any resource
Get auto-graded reports
Continue with Google

Continue with Email
Continue with Classlink
Continue with Clever
or continue with
Microsoft
%20(1).png)
Apple
Others
Already have an account?
