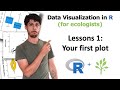
Data Visualization Concepts in R
Interactive Video
•
Biology, Computers, Science
•
10th - 12th Grade
•
Practice Problem
•
Hard

Patricia Brown
FREE Resource
Read more
10 questions
Show all answers
1.
MULTIPLE CHOICE QUESTION
30 sec • 1 pt
What is the primary focus of this course?
Data cleaning and preprocessing
Basics of data visualization with R
Advanced statistical analysis
Machine learning techniques
2.
MULTIPLE CHOICE QUESTION
30 sec • 1 pt
Which dataset is used in this lesson for visualization?
Cars dataset
Iris dataset
Plant growth dataset
Air quality dataset
3.
MULTIPLE CHOICE QUESTION
30 sec • 1 pt
What additional column is added to the 'plant growth' dataset?
Amount of water received
Plant height
Soil type
Sunlight exposure
4.
MULTIPLE CHOICE QUESTION
30 sec • 1 pt
What function is used to create a scatter plot in R?
chart()
graph()
plot()
scatter()
5.
MULTIPLE CHOICE QUESTION
30 sec • 1 pt
In the scatter plot, what does the x-axis represent?
Number of leaves
Amount of water received
Plant height
Plant weight
6.
MULTIPLE CHOICE QUESTION
30 sec • 1 pt
What symbol is used in R to indicate 'is a function of'?
Caret (^)
Asterisk (*)
Ampersand (&)
Tilde (~)
7.
MULTIPLE CHOICE QUESTION
30 sec • 1 pt
What is the benefit of using the tilde notation in the plot function?
It increases the speed of plot rendering.
It automatically colors the plot.
It allows for 3D plotting.
It simplifies the code by removing the need to specify the data source repeatedly.
Access all questions and much more by creating a free account
Create resources
Host any resource
Get auto-graded reports
Continue with Google

Continue with Email
Continue with Classlink
Continue with Clever
or continue with
Microsoft
%20(1).png)
Apple
Others
Already have an account?
Similar Resources on Wayground
Popular Resources on Wayground

15 questions
Fractions on a Number Line
Quiz
•
3rd Grade
20 questions
Equivalent Fractions
Quiz
•
3rd Grade
25 questions
Multiplication Facts
Quiz
•
5th Grade
29 questions
Alg. 1 Section 5.1 Coordinate Plane
Quiz
•
9th Grade
22 questions
fractions
Quiz
•
3rd Grade
11 questions
FOREST Effective communication
Lesson
•
KG
20 questions
Main Idea and Details
Quiz
•
5th Grade
20 questions
Context Clues
Quiz
•
6th Grade
Discover more resources for Biology
21 questions
Cell Cycle and mitosis
Quiz
•
9th - 10th Grade
20 questions
Food Chains and Food Webs
Quiz
•
7th - 12th Grade
10 questions
Exploring Food Webs and Energy Pyramids
Interactive video
•
6th - 10th Grade
10 questions
Exploring the Impact of Genetic Mutations
Interactive video
•
6th - 10th Grade
5 questions
Inherited and Acquired Traits of Animals
Interactive video
•
4th Grade - University
12 questions
Carbon Cycle and Organic Chemistry Concepts
Interactive video
•
9th - 10th Grade
38 questions
Mitosis & Meiosis
Quiz
•
9th - 12th Grade
36 questions
DNA & Protein Synthesis 3.1.1-3.1.3
Quiz
•
9th - 12th Grade