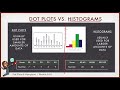
Understanding Histograms and Dot Plots
Interactive Video
•
Mathematics
•
6th - 7th Grade
•
Practice Problem
•
Hard

Patricia Brown
FREE Resource
Read more
10 questions
Show all answers
1.
MULTIPLE CHOICE QUESTION
30 sec • 1 pt
What is the primary purpose of a dot plot?
To display the frequency of data values using dots
To show changes over time
To show the relationship between two variables
To compare different categories
2.
MULTIPLE CHOICE QUESTION
30 sec • 1 pt
How can you identify a symmetric dot plot?
The dots are evenly spaced
The peak is in the middle, resembling a mountain
The peak is on the right side
The peak is on the left side
3.
MULTIPLE CHOICE QUESTION
30 sec • 1 pt
What does it mean if a dot plot is skewed to the right?
There are more dots on the right side
There are fewer dots on the right side
The peak is in the middle
The dots form a straight line
4.
MULTIPLE CHOICE QUESTION
30 sec • 1 pt
What is the first step in creating a histogram?
Label the axes
Draw the bars
Group the data into intervals
Title the graph
5.
MULTIPLE CHOICE QUESTION
30 sec • 1 pt
In a histogram, what does the y-axis represent?
The total number of data points
The frequency of data
The data intervals
The categories
6.
MULTIPLE CHOICE QUESTION
30 sec • 1 pt
What is a key difference between a histogram and a bar chart?
Histograms have gaps between bars
Bar charts show frequency on the y-axis
Bar charts use numbers on the x-axis
Histograms have no gaps between bars
7.
MULTIPLE CHOICE QUESTION
30 sec • 1 pt
Which type of data is best represented by a dot plot?
Data over time
Small data sets
Data with categories
Large data sets
Access all questions and much more by creating a free account
Create resources
Host any resource
Get auto-graded reports
Continue with Google

Continue with Email
Continue with Classlink
Continue with Clever
or continue with
Microsoft
%20(1).png)
Apple
Others
Already have an account?
