Understanding Histograms and Dot Plots
Interactive Video
•
Mathematics
•
5th - 6th Grade
•
Practice Problem
•
Hard

Patricia Brown
FREE Resource
Read more
10 questions
Show all answers
1.
MULTIPLE CHOICE QUESTION
30 sec • 1 pt
What is the primary objective of the lesson on dot plots and histograms?
To understand scatter plots
To represent data using histograms
To compare bar graphs and line graphs
To learn about pie charts
2.
MULTIPLE CHOICE QUESTION
30 sec • 1 pt
What is a dot plot primarily used for?
Calculating the mean
Finding the median
Determining the range
Identifying the mode
3.
MULTIPLE CHOICE QUESTION
30 sec • 1 pt
How do you create a dot plot?
By placing dots above a number line for each data point
By connecting data points with lines
By drawing bars for each data point
By shading areas under a curve
4.
MULTIPLE CHOICE QUESTION
30 sec • 1 pt
What is the first step in creating a histogram?
Drawing a number line
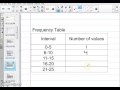
Creating a frequency table
Identifying the mode
Calculating the mean
5.
MULTIPLE CHOICE QUESTION
30 sec • 1 pt
What does a frequency table help you determine?
The average of the data
The range of the data
The distribution of data within intervals
The mode of the data
6.
MULTIPLE CHOICE QUESTION
30 sec • 1 pt
How is a histogram different from a dot plot?
It uses lines instead of dots
It represents data distribution with bars
It uses colors to differentiate data
It shows data trends over time
7.
MULTIPLE CHOICE QUESTION
30 sec • 1 pt
What should you do after organizing data in a frequency table?
Calculate the mean
Draw a pie chart
Create a histogram
Find the median
Access all questions and much more by creating a free account
Create resources
Host any resource
Get auto-graded reports
Continue with Google

Continue with Email
Continue with Classlink
Continue with Clever
or continue with
Microsoft
%20(1).png)
Apple
Others
Already have an account?
