Data Representation and Analysis Concepts
Interactive Video
•
Mathematics, Science, Business
•
6th - 8th Grade
•
Practice Problem
•
Hard

Patricia Brown
FREE Resource
Read more
10 questions
Show all answers
1.
MULTIPLE CHOICE QUESTION
30 sec • 1 pt
What are the two main methods of data presentation discussed in the video?
Pie charts and line graphs
Tables and pie charts
Frequency tables and bar graphs
Histograms and scatter plots
2.
MULTIPLE CHOICE QUESTION
30 sec • 1 pt
What does the first column in a frequency table represent?
The total number of data points
The categories of data collected
The sum of all data values
The average of the data
3.
MULTIPLE CHOICE QUESTION
30 sec • 1 pt
In a frequency table, what does the second column indicate?
The cumulative frequency
The frequency of each category
The categories of data
The percentage of each category
4.
MULTIPLE CHOICE QUESTION
30 sec • 1 pt
What is the horizontal axis in a bar graph used for?
Representing the average value
Displaying the frequency
Showing the categories
Indicating the total data points
5.
MULTIPLE CHOICE QUESTION
30 sec • 1 pt
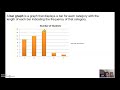
How can you determine the frequency of a category in a bar graph?
By counting the number of bars
By observing the height of the bar
By checking the color of the bar
By looking at the width of the bar
6.
MULTIPLE CHOICE QUESTION
30 sec • 1 pt
What is a key advantage of using bar graphs over frequency tables?
They are easier to create
They provide a visual representation
They require less data
They are more accurate
7.
MULTIPLE CHOICE QUESTION
30 sec • 1 pt
What was the risk factor analyzed by insurance companies in the example?
The speed of the car
The color of the car
The type of car
The age of the driver
Access all questions and much more by creating a free account
Create resources
Host any resource
Get auto-graded reports
Continue with Google

Continue with Email
Continue with Classlink
Continue with Clever
or continue with
Microsoft
%20(1).png)
Apple
Others
Already have an account?
Popular Resources on Wayground

15 questions
Fractions on a Number Line
Quiz
•
3rd Grade
10 questions
Probability Practice
Quiz
•
4th Grade
15 questions
Probability on Number LIne
Quiz
•
4th Grade
20 questions
Equivalent Fractions
Quiz
•
3rd Grade
25 questions
Multiplication Facts
Quiz
•
5th Grade
22 questions
fractions
Quiz
•
3rd Grade
6 questions
Appropriate Chromebook Usage
Lesson
•
7th Grade
10 questions
Greek Bases tele and phon
Quiz
•
6th - 8th Grade
Discover more resources for Mathematics
20 questions
Writing Algebraic Expressions
Quiz
•
6th Grade
20 questions
Ratios/Rates and Unit Rates
Quiz
•
6th Grade
14 questions
Volume of rectangular prisms
Quiz
•
7th Grade
15 questions
Graphing Inequalities
Quiz
•
7th - 9th Grade
20 questions
Graphing Inequalities on a Number Line
Quiz
•
6th - 9th Grade
20 questions
One Step Equations
Quiz
•
6th Grade
12 questions
One-Step Equations
Quiz
•
6th Grade
6 questions
Equations from models
Quiz
•
6th Grade