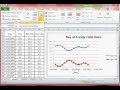
Graphing Tides in Excel
Interactive Video
•
Computers, Mathematics, Science
•
9th - 10th Grade
•
Practice Problem
•
Hard

Patricia Brown
FREE Resource
Read more
10 questions
Show all answers
1.
MULTIPLE CHOICE QUESTION
30 sec • 1 pt
What is the primary task described in the video tutorial?
Designing a bar chart for sales data
Analyzing temperature changes over a year
Creating a pie chart of rainfall data
Graphing the tides in the Bay of Fundy using Excel
2.
MULTIPLE CHOICE QUESTION
30 sec • 1 pt
What should you do if you see number signs in the Excel columns?
Change the font size
Double-click to adjust the column width
Insert a new row
Delete the column
3.
MULTIPLE CHOICE QUESTION
30 sec • 1 pt
Which type of chart is used to graph the tides?
Scatter plot with smooth curves
Line chart
Bar chart
Pie chart
4.
MULTIPLE CHOICE QUESTION
30 sec • 1 pt
What should be selected as the X Series values for the high tide series?
The name at the top
The dates
The high tide values
The low tide values
5.
MULTIPLE CHOICE QUESTION
30 sec • 1 pt
What is the series name for the second data series added to the chart?
Tide difference
Average tide
Low tide
High tide
6.
MULTIPLE CHOICE QUESTION
30 sec • 1 pt
What should you do after adding both data series to the chart?
Add titles to the chart
Change the chart type
Delete the chart
Insert a new worksheet
7.
MULTIPLE CHOICE QUESTION
30 sec • 1 pt
Where should the chart title be placed?
Below the chart
To the right of the chart
Above the chart
To the left of the chart
Access all questions and much more by creating a free account
Create resources
Host any resource
Get auto-graded reports
Continue with Google

Continue with Email
Continue with Classlink
Continue with Clever
or continue with
Microsoft
%20(1).png)
Apple
Others
Already have an account?
Popular Resources on Wayground

15 questions
Fractions on a Number Line
Quiz
•
3rd Grade
20 questions
Equivalent Fractions
Quiz
•
3rd Grade
25 questions
Multiplication Facts
Quiz
•
5th Grade
29 questions
Alg. 1 Section 5.1 Coordinate Plane
Quiz
•
9th Grade
22 questions
fractions
Quiz
•
3rd Grade
11 questions
FOREST Effective communication
Lesson
•
KG
20 questions
Main Idea and Details
Quiz
•
5th Grade
20 questions
Context Clues
Quiz
•
6th Grade