Understanding Box Plots and Distributions
Interactive Video
•
Mathematics
•
9th - 10th Grade
•
Practice Problem
•
Hard

Patricia Brown
FREE Resource
Read more
10 questions
Show all answers
1.
MULTIPLE CHOICE QUESTION
30 sec • 1 pt
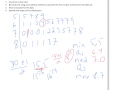
What is the lowest value in the data set?
5.5
6.4
7.0
8.7
2.
MULTIPLE CHOICE QUESTION
30 sec • 1 pt
What is used as the stem in a stem plot?
Units digit
Tenths digit
Hundreds digit
Thousands digit
3.
MULTIPLE CHOICE QUESTION
30 sec • 1 pt
How many data points are in the data set?
30
15
60
45
4.
MULTIPLE CHOICE QUESTION
30 sec • 1 pt
What is the median value of the data set?
8.7
7.0
6.4
7.7
5.
MULTIPLE CHOICE QUESTION
30 sec • 1 pt
Which number represents the lower quartile?
5.5
7.7
6.4
7.0
6.
MULTIPLE CHOICE QUESTION
30 sec • 1 pt
What is the upper quartile value?
7.7
6.4
7.0
8.7
7.
MULTIPLE CHOICE QUESTION
30 sec • 1 pt
What is the purpose of a box plot?
To show only the median
To display the five-number summary
To list all data points
To calculate the mean
Access all questions and much more by creating a free account
Create resources
Host any resource
Get auto-graded reports
Continue with Google

Continue with Email
Continue with Classlink
Continue with Clever
or continue with
Microsoft
%20(1).png)
Apple
Others
Already have an account?
