Excel Scatter Plot Analysis and Features
Interactive Video
•
Mathematics, Chemistry, Science
•
9th - 10th Grade
•
Practice Problem
•
Hard

Patricia Brown
FREE Resource
Read more
10 questions
Show all answers
1.
MULTIPLE CHOICE QUESTION
30 sec • 1 pt
What information is included in the stable nuclides spreadsheet?
Elements, atomic numbers, mass numbers, and stable isotopes
Only mass numbers
Only atomic numbers
Only stable isotopes
2.
MULTIPLE CHOICE QUESTION
30 sec • 1 pt
How do you calculate the number of neutrons using Excel?
Divide the mass number by the atomic number
Multiply the atomic number by the mass number
Subtract the atomic number from the mass number
Add the atomic number to the mass number
3.
MULTIPLE CHOICE QUESTION
30 sec • 1 pt
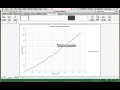
What is the purpose of plotting a scatter plot in Excel in this context?
To find the heaviest element
To determine the most stable isotope
To analyze the relationship between atomic numbers and neutron numbers
To compare different elements
4.
MULTIPLE CHOICE QUESTION
30 sec • 1 pt
What is the first step in creating a scatter plot in Excel?
Insert a pie chart
Highlight the data columns
Use the Solver tool
Apply conditional formatting
5.
MULTIPLE CHOICE QUESTION
30 sec • 1 pt
Which Excel feature allows you to add chart elements like axis titles?
Quick Layout
Data Analysis Toolpak
Conditional Formatting
Solver
6.
MULTIPLE CHOICE QUESTION
30 sec • 1 pt
Why might the scatter plot not look like the one in the textbook?
Different data is used
The data is incomplete
Axes and scale are different
The chart type is incorrect
7.
MULTIPLE CHOICE QUESTION
30 sec • 1 pt
How can you ensure the axes are correctly labeled in Excel?
By applying conditional formatting
By using the Solver tool
By using the Data Analysis Toolpak
By checking the data and adjusting if necessary
Access all questions and much more by creating a free account
Create resources
Host any resource
Get auto-graded reports
Continue with Google

Continue with Email
Continue with Classlink
Continue with Clever
or continue with
Microsoft
%20(1).png)
Apple
Others
Already have an account?
Popular Resources on Wayground

7 questions
History of Valentine's Day
Interactive video
•
4th Grade
15 questions
Fractions on a Number Line
Quiz
•
3rd Grade
20 questions
Equivalent Fractions
Quiz
•
3rd Grade
25 questions
Multiplication Facts
Quiz
•
5th Grade
22 questions
fractions
Quiz
•
3rd Grade
15 questions
Valentine's Day Trivia
Quiz
•
3rd Grade
20 questions
Main Idea and Details
Quiz
•
5th Grade
20 questions
Context Clues
Quiz
•
6th Grade
Discover more resources for Mathematics
20 questions
Graphing Inequalities on a Number Line
Quiz
•
6th - 9th Grade
20 questions
Exponent Properties
Quiz
•
9th Grade
15 questions
Combine Like Terms and Distributive Property
Quiz
•
8th - 9th Grade
20 questions
Function or Not a Function
Quiz
•
8th - 9th Grade
10 questions
Factor Quadratic Expressions with Various Coefficients
Quiz
•
9th - 12th Grade
10 questions
Elijah McCoy: Innovations and Impact in Black History
Interactive video
•
6th - 10th Grade
21 questions
Factoring Trinomials (a=1)
Quiz
•
9th Grade
5 questions
Triangle Congruence Theorems
Interactive video
•
9th - 12th Grade