Graphing Scales and Accuracy
Interactive Video
•
Mathematics, Science, Physics
•
9th - 10th Grade
•
Practice Problem
•
Hard

Patricia Brown
FREE Resource
Read more
10 questions
Show all answers
1.
MULTIPLE CHOICE QUESTION
30 sec • 1 pt
Why is it important to choose the correct scale when plotting graphs?
To make the graph look more colorful
To ensure the graph fits on the paper
To make the graph easier to erase
To optimize the use of graph paper and ensure plotted points occupy more than half of the available area
2.
MULTIPLE CHOICE QUESTION
30 sec • 1 pt
What is the first step in determining the proper scale for plotting values?
Computing the range of values for time and distance
Labeling the graph
Choosing the color of the graph paper
Drawing the axes
3.
MULTIPLE CHOICE QUESTION
30 sec • 1 pt
How do you compute the range of values for time?
By adding the smallest and largest values
By subtracting the smallest value from the largest value
By multiplying the smallest value by the largest value
By dividing the largest value by the smallest value
4.
MULTIPLE CHOICE QUESTION
30 sec • 1 pt
Why is it important to choose a scale that is easy to plot?
To reduce the number of points on the graph
To ensure the graph is colorful
To make plotting easier and ensure the graph is of proper size
To make the graph look more artistic
5.
MULTIPLE CHOICE QUESTION
30 sec • 1 pt
What happens if you choose a scale that is not easy to plot?
The graph will be more accurate
The graph will be smaller and harder to interpret
The graph will be larger and easier to read
The graph will have more colors
6.
MULTIPLE CHOICE QUESTION
30 sec • 1 pt
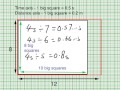
In the example provided, what was the scale used for the time axis?
1 big square = 0.2 seconds
1 big square = 0.5 seconds
1 big square = 1 second
1 big square = 0.8 seconds
7.
MULTIPLE CHOICE QUESTION
30 sec • 1 pt
What is the impact of using a smaller scale on the graph?
It increases the number of plotted points
It makes the graph smaller and less accurate
It reduces random error
It makes the graph larger
Access all questions and much more by creating a free account
Create resources
Host any resource
Get auto-graded reports
Continue with Google

Continue with Email
Continue with Classlink
Continue with Clever
or continue with
Microsoft
%20(1).png)
Apple
Others
Already have an account?
