Tsunami Data Analysis and Interpretation
Interactive Video
•
Science, Geography, Other
•
6th - 8th Grade
•
Practice Problem
•
Hard

Patricia Brown
FREE Resource
Read more
10 questions
Show all answers
1.
MULTIPLE CHOICE QUESTION
30 sec • 1 pt
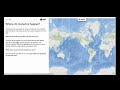
What is the primary focus of the first story map in the lesson?
To show the locations of recent earthquakes
To demonstrate the causes of tsunamis
To illustrate where tsunamis occur globally
To explain the mechanism of tsunami formation
2.
MULTIPLE CHOICE QUESTION
30 sec • 1 pt
Which geologic process is represented by black dots on the story map?
Volcanic eruptions
Tsunami waves
Earthquakes
Landslides
3.
MULTIPLE CHOICE QUESTION
30 sec • 1 pt
What is the main cause of most tsunamis according to the lesson?
Earthquakes
Meteor impacts
Landslides
Volcanic eruptions
4.
MULTIPLE CHOICE QUESTION
30 sec • 1 pt
What additional information does the swipe map provide about earthquakes?
The height of tsunami waves
The type of plate boundaries
The speed of tsunami waves
The depth of each earthquake
5.
MULTIPLE CHOICE QUESTION
30 sec • 1 pt
Where do most earthquakes that cause tsunamis occur according to the swipe map?
In the Arctic Ocean
Along the Pacific Ocean
In the Indian Ocean
Along the Atlantic Ocean
6.
MULTIPLE CHOICE QUESTION
30 sec • 1 pt
What is the significance of the red line on the swipe map?
It marks the boundary of the Pacific Ocean
It indicates areas with no tsunami activity
It represents the equator
It shows where most tsunamis occur
7.
MULTIPLE CHOICE QUESTION
30 sec • 1 pt
What feature allows students to compare recent earthquakes with those that cause tsunamis?
The legend
The zoom function
The filter links
The swipe bar
Access all questions and much more by creating a free account
Create resources
Host any resource
Get auto-graded reports
Continue with Google

Continue with Email
Continue with Classlink
Continue with Clever
or continue with
Microsoft
%20(1).png)
Apple
Others
Already have an account?
