Graphical Relationships in Motion
Interactive Video
•
Mathematics, Physics, Science
•
9th - 10th Grade
•
Practice Problem
•
Hard

Patricia Brown
FREE Resource
Read more
10 questions
Show all answers
1.
MULTIPLE CHOICE QUESTION
30 sec • 1 pt
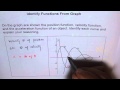
What are the three functions shown on the graph?
Energy, Power, and Work
Height, Time, and Mass
Distance, Speed, and Force
Position, Velocity, and Acceleration
2.
MULTIPLE CHOICE QUESTION
30 sec • 1 pt
How is velocity related to position?
Velocity is the product of position and acceleration
Velocity is the difference between position and acceleration
Velocity is the sum of position and time
Velocity is the rate of change of position
3.
MULTIPLE CHOICE QUESTION
30 sec • 1 pt
What does a tangent line with a slope of zero indicate on a graph?
A point of minimum acceleration
A constant rate of change
A point of maximum velocity
A turning point
4.
MULTIPLE CHOICE QUESTION
30 sec • 1 pt
Which graph represents the rate of change of the position function?
Graph D
Graph C
Graph B
Graph A
5.
MULTIPLE CHOICE QUESTION
30 sec • 1 pt
If graph C represents velocity, what does graph A represent?
Distance
Position
Acceleration
Time
6.
MULTIPLE CHOICE QUESTION
30 sec • 1 pt
What is the relationship between acceleration and velocity?
Acceleration is the product of velocity and position
Acceleration is the difference between velocity and position
Acceleration is the sum of velocity and time
Acceleration is the rate of change of velocity
7.
MULTIPLE CHOICE QUESTION
30 sec • 1 pt
Which graph is identified as representing position?
Graph D
Graph C
Graph B
Graph A
Access all questions and much more by creating a free account
Create resources
Host any resource
Get auto-graded reports
Continue with Google

Continue with Email
Continue with Classlink
Continue with Clever
or continue with
Microsoft
%20(1).png)
Apple
Others
Already have an account?
