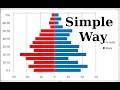
Population Pyramid Chart Formatting
Interactive Video
•
Mathematics, Computers, Design
•
9th - 10th Grade
•
Practice Problem
•
Hard

Patricia Brown
FREE Resource
Read more
10 questions
Show all answers
1.
MULTIPLE CHOICE QUESTION
30 sec • 1 pt
What is the primary purpose of a population pyramid?
To compare different countries' GDP
To illustrate climate change effects
To show population distribution by age and gender
To display economic growth
2.
MULTIPLE CHOICE QUESTION
30 sec • 1 pt
Why is it necessary to create negative values for male data in a population pyramid?
To increase the chart's complexity
To make the chart more colorful
To represent males on the left side of the pyramid
To balance the data with female values
3.
MULTIPLE CHOICE QUESTION
30 sec • 1 pt
Which type of chart is initially used to create a population pyramid?
2D bar chart
Scatter plot
Line chart
Pie chart
4.
MULTIPLE CHOICE QUESTION
30 sec • 1 pt
What is the purpose of removing duplicate data in the chart?
To reduce the file size
To enhance the visual appeal
To simplify the chart
To ensure accurate representation of data
5.
MULTIPLE CHOICE QUESTION
30 sec • 1 pt
How can you change the color of the bars in the population pyramid?
By changing the data source
By using the 'Insert' menu
By adjusting the chart's axis
By selecting 'Format Data Series' and choosing 'Fill'
6.
MULTIPLE CHOICE QUESTION
30 sec • 1 pt
What is the effect of increasing the overlap between bars in the chart?
It changes the bar colors
It reduces the space between bars
It makes the bars wider
It increases the chart's height
7.
MULTIPLE CHOICE QUESTION
30 sec • 1 pt
Why is it important to reverse the order of categories in a population pyramid?
To make the chart more colorful
To increase the chart's complexity
To align the data with standard pyramid orientation
To balance the data with female values
Access all questions and much more by creating a free account
Create resources
Host any resource
Get auto-graded reports
Continue with Google

Continue with Email
Continue with Classlink
Continue with Clever
or continue with
Microsoft
%20(1).png)
Apple
Others
Already have an account?
Popular Resources on Wayground

15 questions
Fractions on a Number Line
Quiz
•
3rd Grade
20 questions
Equivalent Fractions
Quiz
•
3rd Grade
25 questions
Multiplication Facts
Quiz
•
5th Grade
29 questions
Alg. 1 Section 5.1 Coordinate Plane
Quiz
•
9th Grade
22 questions
fractions
Quiz
•
3rd Grade
11 questions
FOREST Effective communication
Lesson
•
KG
20 questions
Main Idea and Details
Quiz
•
5th Grade
20 questions
Context Clues
Quiz
•
6th Grade
Discover more resources for Mathematics
29 questions
Alg. 1 Section 5.1 Coordinate Plane
Quiz
•
9th Grade
20 questions
Graphing Inequalities on a Number Line
Quiz
•
6th - 9th Grade
20 questions
Box and Whisker Plots
Quiz
•
9th Grade
18 questions
Exponential Growth and Decay
Quiz
•
9th Grade
20 questions
Function or Not a Function
Quiz
•
8th - 9th Grade
20 questions
SSS/SAS
Quiz
•
9th - 12th Grade
14 questions
Making Inferences From Samples
Quiz
•
7th - 12th Grade
23 questions
CCG - CH8 Polygon angles and area Review
Quiz
•
9th - 12th Grade