Analyzing Rabbit Population Dynamics Through Graphical Representations
Interactive Video
•
Biology, Science, Mathematics
•
9th - 10th Grade
•
Practice Problem
•
Hard

Patricia Brown
FREE Resource
Read more
7 questions
Show all answers
1.
MULTIPLE CHOICE QUESTION
30 sec • 1 pt
Which types of graphs are introduced for understanding experimental results?
Bar graphs, pie charts, and scatter plots
Line graphs, histograms, and dot plots
Flowcharts, Venn diagrams, and pie charts
Scatter plots, bar graphs, and line graphs
2.
MULTIPLE CHOICE QUESTION
30 sec • 1 pt
What happens to the rabbit population when food is unlimited?
It increases exponentially over time
It decreases linearly over time
It fluctuates randomly
It remains constant
3.
MULTIPLE CHOICE QUESTION
30 sec • 1 pt
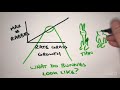
What shape does the graph take when plotting the maximum number of rabbits against the rate of grass growth?
A circular pattern
A zigzag line
A straight line
A curved line
4.
MULTIPLE CHOICE QUESTION
30 sec • 1 pt
What type of distribution is observed in the rabbit body mass histogram?
Bimodal distribution
Skewed distribution
Uniform distribution
Normal distribution
5.
MULTIPLE CHOICE QUESTION
30 sec • 1 pt
In the histogram of rabbit body mass, what are the two distinct groups identified?
Healthy and sick rabbits
Male and female rabbits
Fat and thin rabbits
Young and old rabbits
6.
MULTIPLE CHOICE QUESTION
30 sec • 1 pt
What does the dot plot reveal about the age and body mass of rabbits?
Old rabbits are the heaviest
Young rabbits are heavier than old rabbits
All age groups have similar body mass
Middle-aged rabbits are usually fat
7.
MULTIPLE CHOICE QUESTION
30 sec • 1 pt
What hypothesis is suggested for why young rabbits are thin?
They eat less food
They hop a lot and burn calories
They have a faster metabolism
They are genetically predisposed to be thin
Access all questions and much more by creating a free account
Create resources
Host any resource
Get auto-graded reports
Continue with Google

Continue with Email
Continue with Classlink
Continue with Clever
or continue with
Microsoft
%20(1).png)
Apple
Others
Already have an account?
Similar Resources on Wayground

11 questions
Understanding Polynomial Zeros and Multiplicity
Interactive video
•
8th - 10th Grade
11 questions
Understanding Domain and Range
Interactive video
•
8th - 10th Grade
7 questions
Understanding Urea: Molar Mass and Composition
Interactive video
•
9th - 10th Grade
8 questions
Converting Moles to Grams
Interactive video
•
9th - 10th Grade
11 questions
Stationary Points and Inflection Analysis
Interactive video
•
9th - 10th Grade
11 questions
Understanding Quadratic Graphs and Functions
Interactive video
•
9th - 10th Grade
11 questions
Trigonometric Functions and Their Inverses
Interactive video
•
9th - 10th Grade
11 questions
Graphing Inequalities and Parabolas
Interactive video
•
8th - 10th Grade
Popular Resources on Wayground
15 questions
Fractions on a Number Line
Quiz
•
3rd Grade
20 questions
Equivalent Fractions
Quiz
•
3rd Grade
25 questions
Multiplication Facts
Quiz
•
5th Grade
29 questions
Alg. 1 Section 5.1 Coordinate Plane
Quiz
•
9th Grade
22 questions
fractions
Quiz
•
3rd Grade
11 questions
FOREST Effective communication
Lesson
•
KG
20 questions
Main Idea and Details
Quiz
•
5th Grade
20 questions
Context Clues
Quiz
•
6th Grade
Discover more resources for Biology
22 questions
Human Body Systems Overview
Quiz
•
9th Grade
25 questions
photosynthesis and cellular respiration
Quiz
•
9th Grade
12 questions
Check Mitosis Vs. Meiosis
Quiz
•
9th Grade
15 questions
DNA Structure and Replication
Quiz
•
9th Grade
21 questions
Cell Cycle and mitosis
Quiz
•
9th - 10th Grade
18 questions
Enzymes and Their Functions Quiz
Quiz
•
9th Grade
20 questions
Food Chains and Food Webs
Quiz
•
7th - 12th Grade
10 questions
Exploring Food Webs and Energy Pyramids
Interactive video
•
6th - 10th Grade